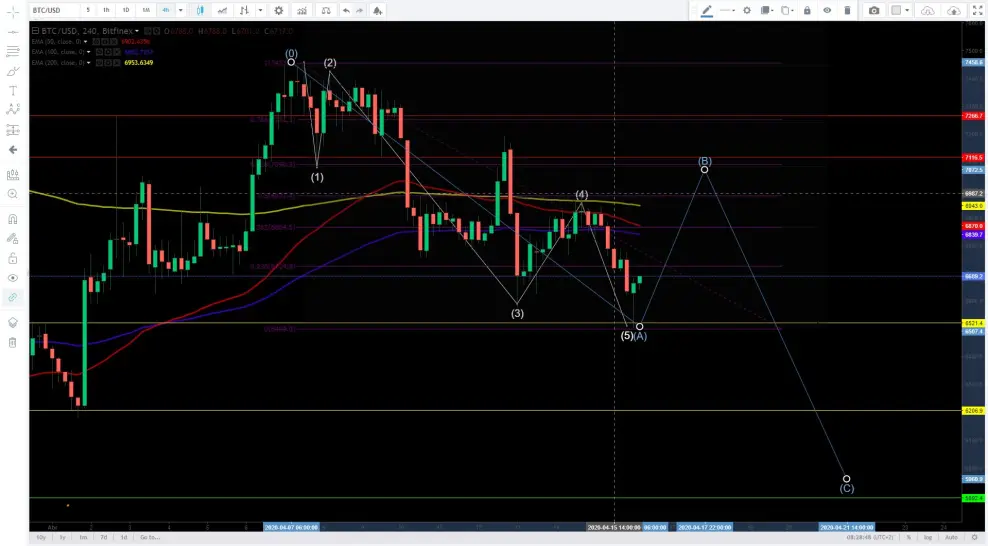
We already know that we are experiencing a downtrend in BITCOIN, here I show you what I see in the technical analysis today.
The green lines are my purchase lines, the yellow lines are to analyze along with other indicators or oscillators in riskier operations, and the red lines are points of sale.
I leave the graph simple at a time of 4 hours.
It can be seen that in wave 4 the price could not support the moving averages and went to look naturally for wave 5. It is always a good idea short in moving average for me.
In waves 2 to 3 we have 5 more waves, in which wave 4 is just below wave 1 and confirms my suspicion.
Fibonacci confirms me when wave 4 reaches 0.5 within the established limits.
I think that now we are going to go up a little but without overcoming the sub wave4 of waves 2a3, there I would go back into shorts to look for wave C that completes the movement closer to halving.
This is not an investment advice, it is only my analysis, I do not recommend that you trust my projection since I am not a financial advisor.
If you liked the analysis and want more articles like this, you can leave a comment in the box below, you can also give a tip and you will be collaborating and keeping the spirit of the person writing.