
It seems that after the recent Bitcoin price hit the high of 2020, CME's open interest contract has jumped to $ 1.16 billion and has become the world's largest Bitcoin Future market. According to Arcane Research, this indicates that institutional investors are not concerned about the recent Bitcoin price correction.
In addition, Guggenheim Partners, Wall Street's largest investment institution, plans to invest in Bitcoin as well, and they filed a request to the Securities and Exchange Commission (SEC) to be able to bring in the Macro Opportunities Fund's net asset value. Invested more than 10% in Bitcoin through the Grayscale Bitcoin Trust, with the funds currently estimated at approximately $ 5.3 billion. So it means that Guggenheim may have invested more than $ 500 million in Bitcoin.
The steady rise in institutional investors' presence indicates that investors remain confident in the long-term in crypto assets.
Raoul Pal, CEO of Global Macro Investor and Real Vision, said the most likely Bitcoin price target would be around $ 150,000 and that could happen by November 2021 if more institutional funds continue to enter the space. Ongoing crypto
Long-term fundamentals of Cryptocurrency Remain positive But prices continue to drop in the short term and investors are likely to view each drop as a good buy-in opportunity.
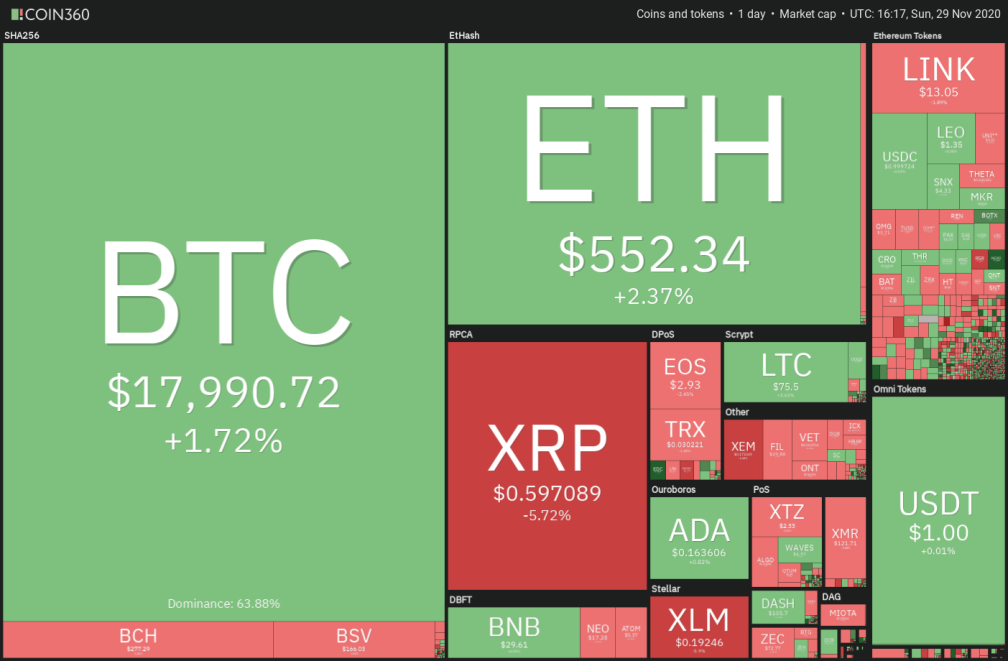
So, in this article, we'll look at what crypto coins are interested in investing
BTC / USD
Bitcoin remains in a strong uptrend. We can see that when the Bitcoin price hit the support at the 20-day EMA, it immediately jumped. This shows that Bitcoin is beginning to gain a buying back. When the price drops
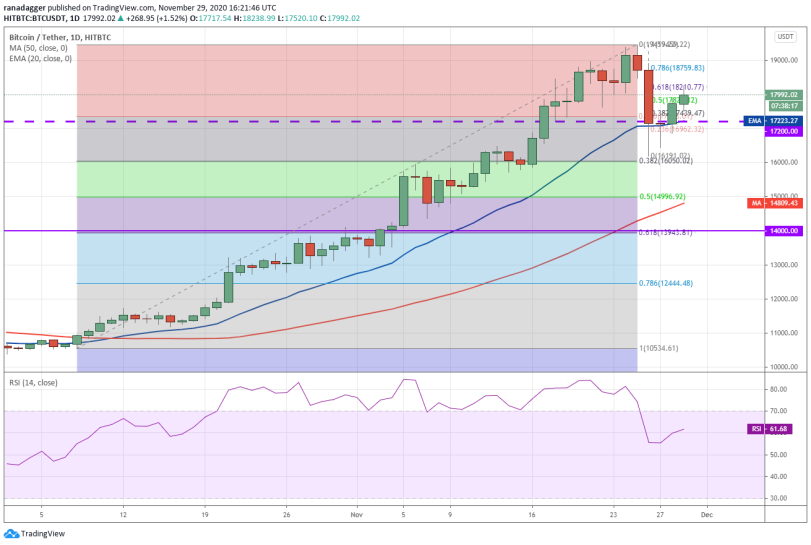
A rising MA and an uptrend RSI indicator indicate that the buyer side is taking advantage.
However, the seller's side starts to move again at the $ 18,210.77 area, the 61.8% Fibonacci retracement level, and if the price falls below this resistance level, it is possible that The process of correction of that price may resume.
On the other hand, if buyers were able to push the closing price above $ 18,210.77 on the daily chart, Bitcoin could continue to rise to $ 19,459.22 and $ 20,000.
However, this uptrend view will immediately become null and void. If the price falls below the current level and plummets below $ 16,000.
ETH / USD
For Ethereum, we can see that on November 26 and 27, The price fell sharply and immediately rebounded. This indicates that investors remain confident in the uptrend of Ethereum.
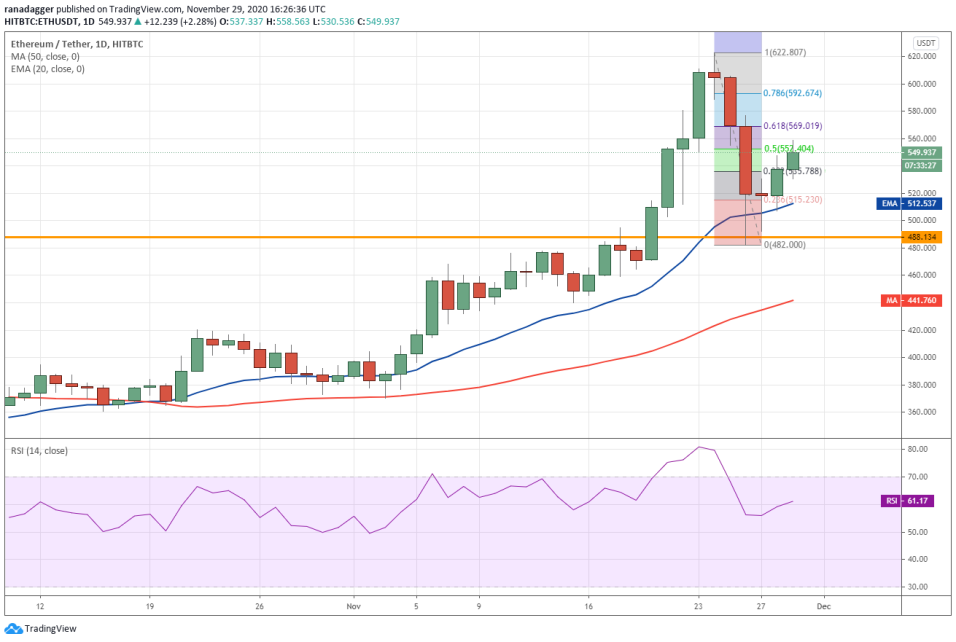
A rising MA and an uptrend RSI indicator indicate that the buyer side is taking advantage. However, buyers may face another strong resistance at the $ 625 area, which is exactly the 61.8% Fibonacci retracement level.
If the price fails to break this resistance The price may continue to test support for the 20-day EMA ($ 512) and $ 482.
On the other hand, if the buyer can push the price to close above $ 569.019, the price could rise to $ 592.674 and then to $ 622.807 anyway.
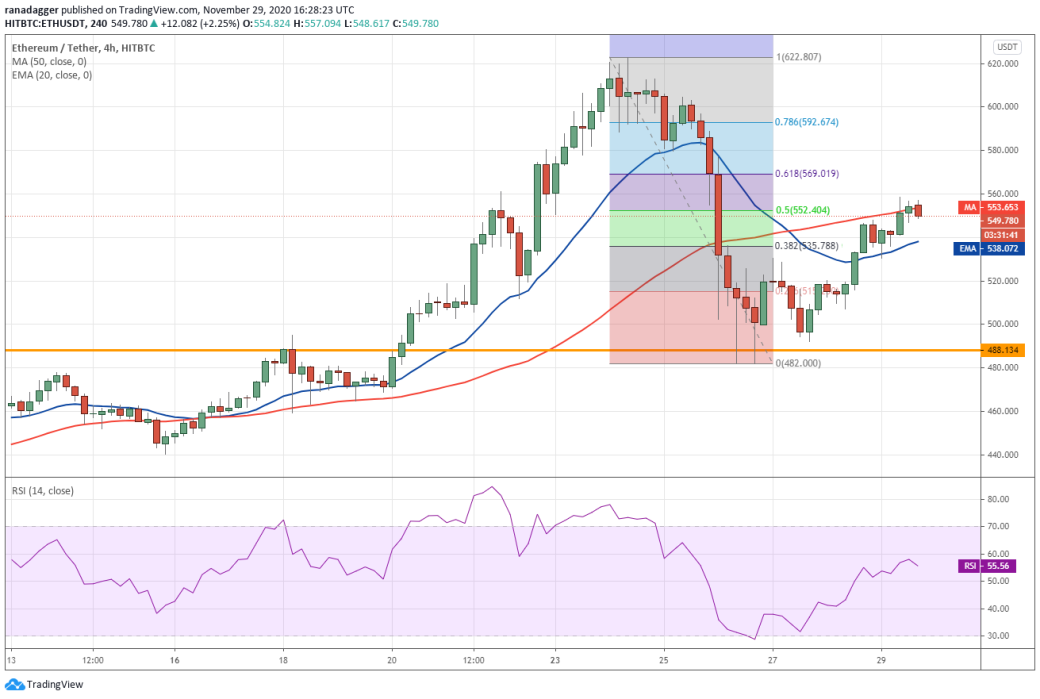
Traders are currently keeping a close eye on the RSI index, because if the RSI can stand above the 60 level, it indicates that buyers are starting to take a more active role in the uptrend. But on the other hand, if the RSI index falls from the level 60, what this means The correction may resume.
ADA / USD
The much-loved coin ADA dropped to 0.1199845 on Nov. 26, before testing the 78.6% Fibonacci retracement at $ 0.1173063 and rebounded again.
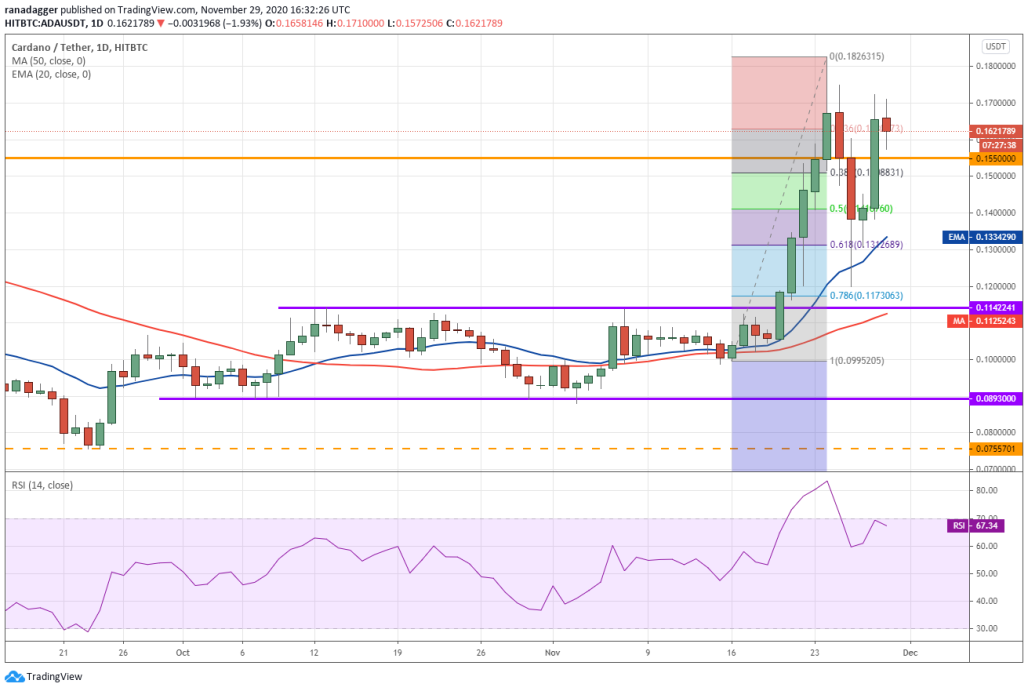
Rising MA and the RSI approaching the overbought point indicates the buyer's advantage. If the buyer could push the price to close above $ 0.1826315, the price could rise to $ 0.2129 and $ 0.235.
On the other hand If the price fails to break through the resistance at $ 0.1826315, these uptrend views are immediately null and void.
XLM/USD
The Stellar Lumens (XLM) correction from a high of 0.231655 before rebounding sharply. This indicates that buyers remain confident in the uptrend of the coin.
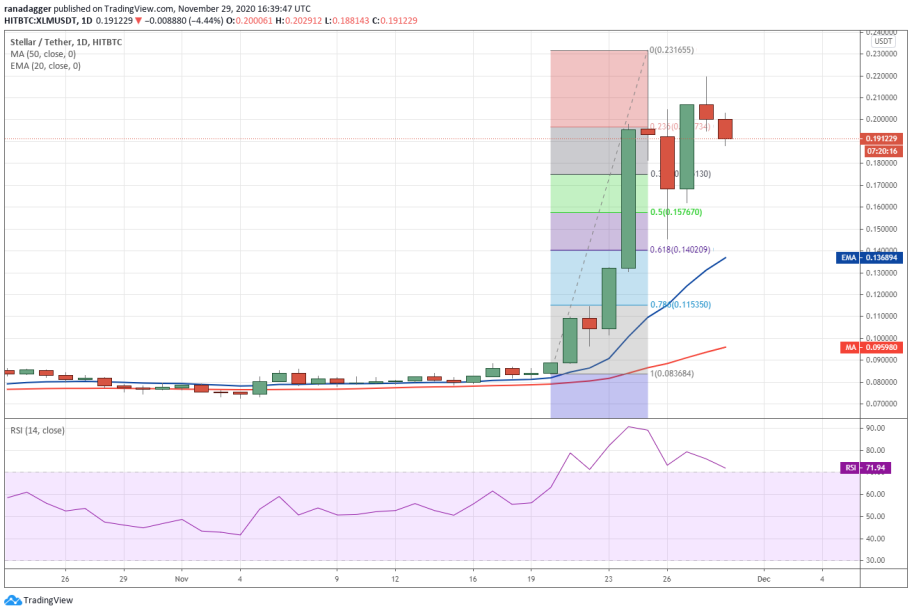
The bullish moving average and and the bullish RSI index indicates the buyer's advantage.
If the buyer can push the price above the $ 0.231655 level, the price may return to a bullish session. With the next target being $ 0.2933
On the other hand, this uptrend will immediately become null and void. If the price drops below the current price level The price may continue to test the support below the $ 0.145 to $ 0.140 level.
XEM / USD
NEM (XEM) was able to break through and hold above $ 0.1690655 on the 25th day before the price hit a high of $ 0.21 and later dropped. The candle wicks that fall deep on the daily chart This indicates that the buyer side wants to sell coins to make a profit at a higher price level.
However, after the price dropped to the 20-day EMA ($ 0.147), the price immediately rebounded. And can stand above the resistance level of 0.1690655 dollar again
At the moment, the buyer side is actively trying to protect the $ 0.1690655 support zone, and if successful, the price of XEM may move further to $ 0.203 - 0.2122.
But contrary to this assumption If the price falls below the $ 0.1690655 level, the price may drop to test the SMA 50 line, and a fall below this level may reverse the test of $ 0.1428512.


