
Charts can tell us a lot about how an asset has preformed to help us better predict how it will act in the future. This idea though is not fool proof and could be very very wrong in either a positive or negative way. To try and get a grasp on how Bitcoin has been acting I went back to the good old chart and looked at the last month.

When reading graphs like this I was always told to push price increase to the back of my mind. While important it’s also super important to pay attention to patterns that you can discern from the graph. While I was concerned that there would not be anything in particular to see luckily that was not the case!
First things first as seen by the trend below the graph is moving at an positive slope at seen below.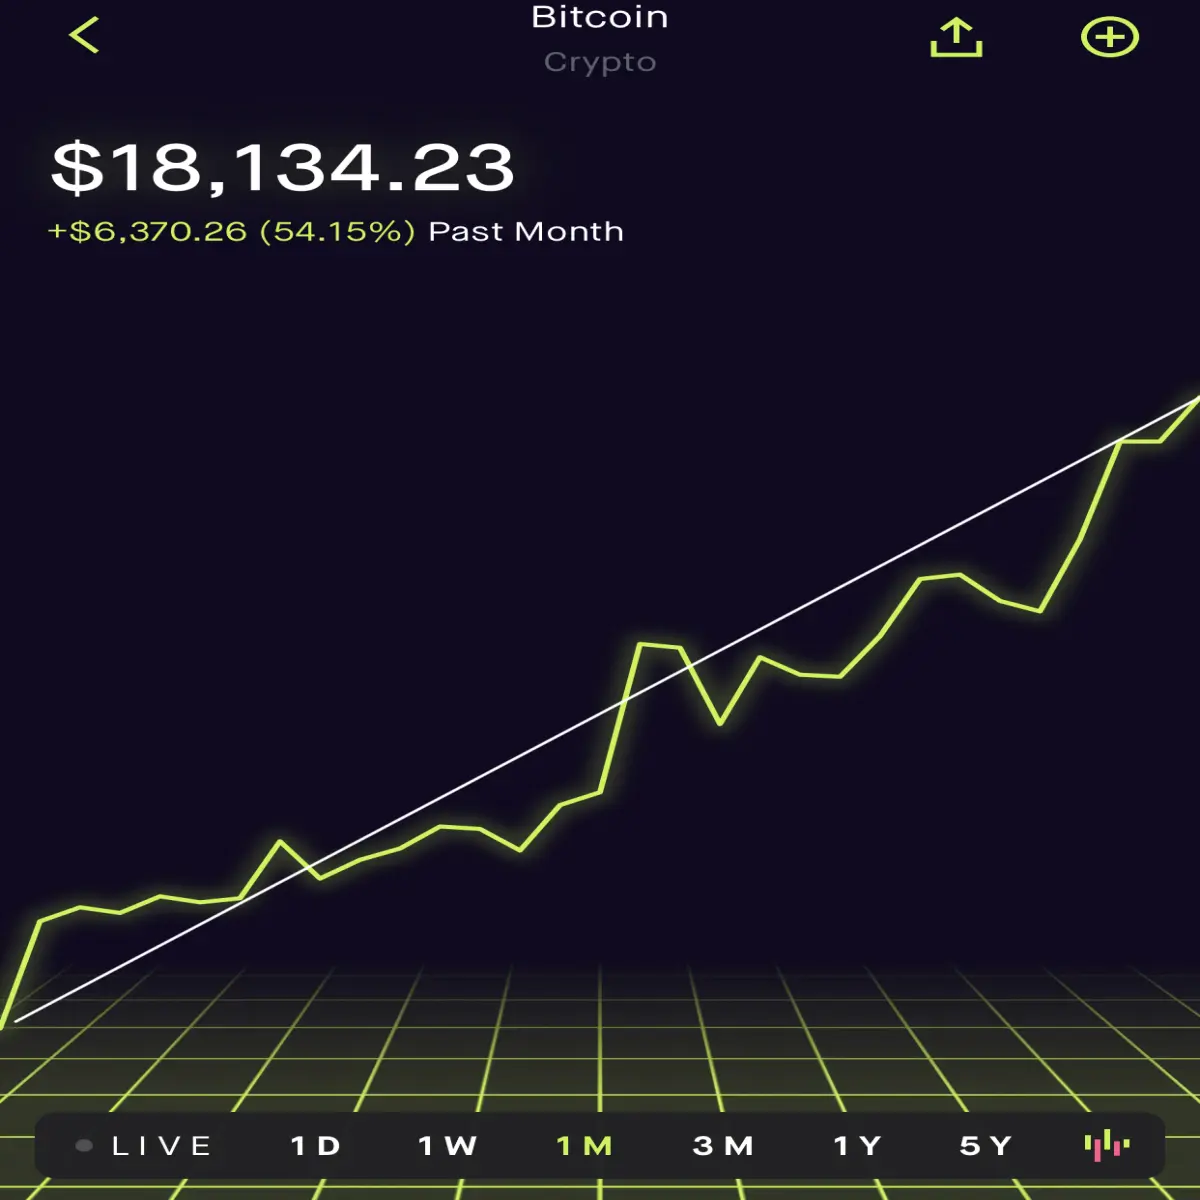
More importantly though is how quick spikes have been handled by Bitcoin.

I have circled the two biggest spikes both of have plateaus after they spike. Given the current price of Bitcoin this one also had a pullback from when I first started working on this article. Granted the first pullback was much more however notice it did not fall below what was the price in the first place.
The charts support that Bitcoin is in the hands of the bulls and for now the bears are kept at bay. This weekend will be rather interesting due to the normal lack of liquidity in the markets over the weekend that allows them to undergo swift and sudden changes. Not since the start of the month has Bitcoin only been lightly trending up. It is rather jumping in quick bursts before leveling off and than doing the same again.
Next week also is the US holiday of Thanksgiving closing the largest financial markets in the world. I do not know how this world affect the liquidity of the Bitcoin market but Grayscale will be “closed” at least in public action.
A pullback would be to expected given the charts of the last month. It could erase almost all the gains from the most recent run up but as long as it stays above the prior value the trend is not in danger of being reversed at all.






