

CEL dropped from above $3 to $0.18 lowest. People marked a “collapsed” tag on Celsius. However, CEL then rally 276% to $0.6784. Collapsing or rallying? Data tells.
CEL Signal Distribution
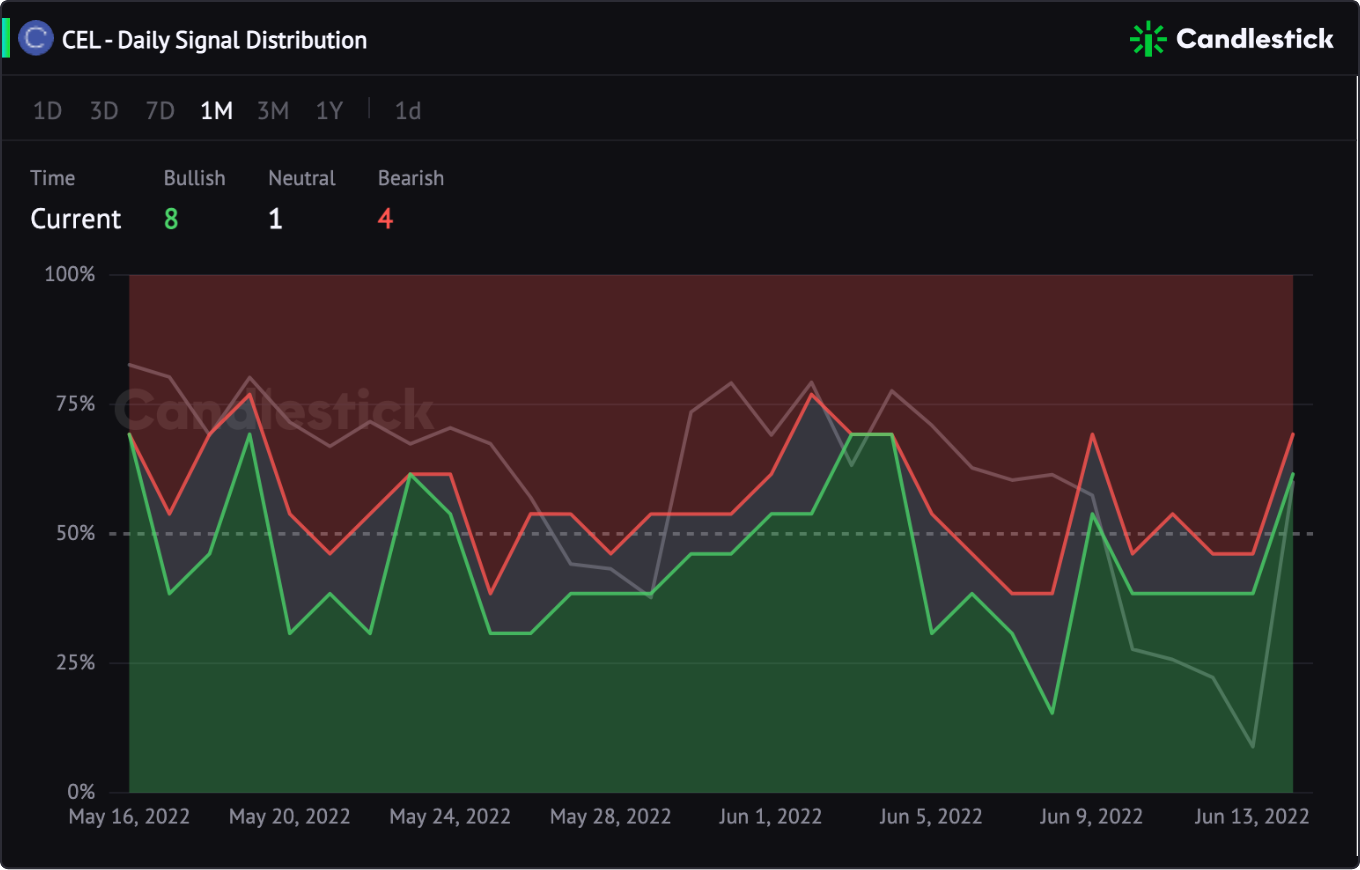
A single bullish signal does not mean something. We need to check the overall signals of a token to analyze the trend. Candlestick signal distribution shows the total signal trend of a token based on 13 exclusive metrics.
See the correlation between CEL signals & CEL token price.😎
When the bearish signals (red) is reducing and the bullish signals (green) is expanding, the price will increase, and vice versus.
Check the CEL signal chart, the red area is smaller and the green area is expanding from May 29 to Jun 4, hence the price is in an uptrend. On Jun 14, the price rebounded, the same as the bullish signals.
Is $0.1606 A Near-Term Price Support?

When the CEL price slumped to the lowest $0.1606, the Turnover Rate surged suddenly to 15.28%. It indicates large sell orders but some traders are taking over the positions by buying the dip.
Trader Tips — How to use Turnover Rate to validate an uptrend?
Is Traders’ Confidence Back During the Rally?
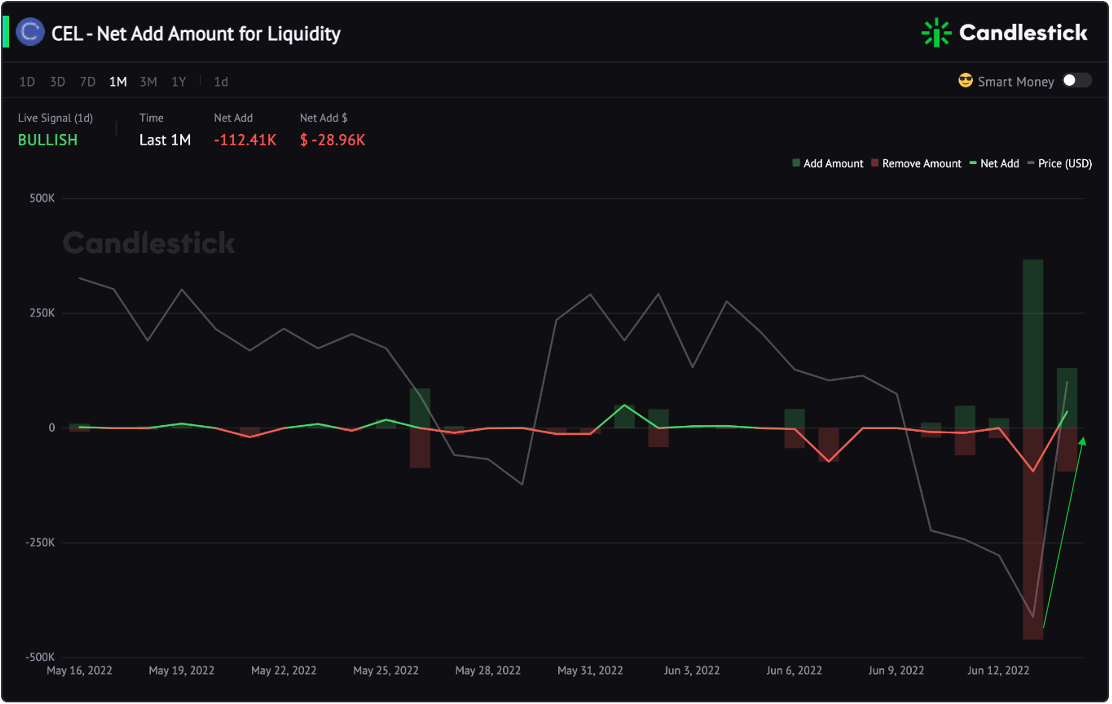
Liquidity is one of the best indicators to valid traders’ confidence. When people are confident in the token price, they tend to provide liquidity in the DEX pools to earn interest.
CEL Net Add Amount for Liquidity
After the CEL’s slump on Jun 13 which caused large liquidity removal, the Net Add Amount for Liquidity turned from negative to positive on Jun 14 with its price rebound.

CEL top 15 LPs TVL did not change in the past 7 days.
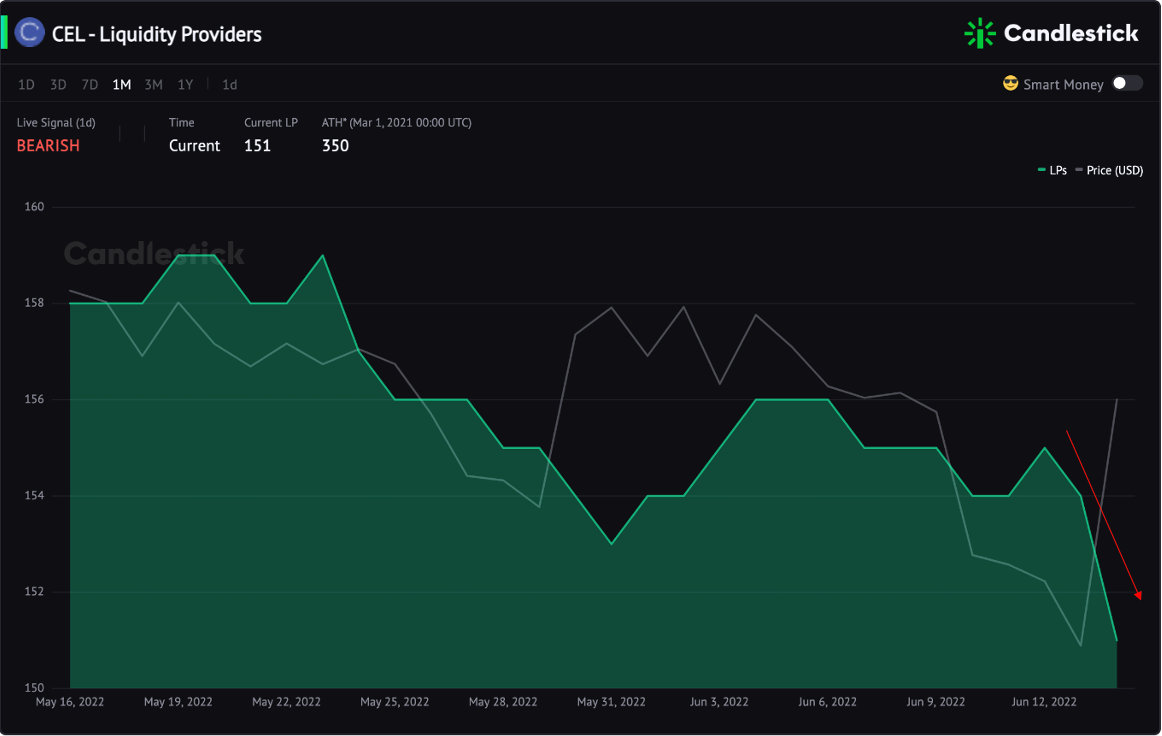
But the number of liquidity providers is continuing to drop regardless of the price rebound.
As such, it shows that the CEL network is supporting prices, while retail traders quit during the price slump.
You may also like:





