
I published the following piece on Medium in January, before USDC depeg.
The Volatility of Stablecoins
Introduction
Stablecoins are designed to keep their value against the benchmark asset, such as a commodity, fiat currency or another cryptocurrency. Most stablecoins created to this day are pegged to US dollar which means they are designed to have a price close to $1. Though typically considered to be a safe haven for the crypto industry, stablecoins did exhibit volatility at times. Especially during turbulent times stablecoins lost their peg to the US dollar losing most of their value. The depeg of UST which also caused Terra blockchain network to collapse is an infamous example.
Not all stablecoins are created equal. Some are governed by a centralized entity while others are decentralized or at least purported to be so. Some stablecoins showed moderate volatility throughout the period we’re looking at while others deviated significantly on occasion. In this article we will look at the volatility of stablecoins over the last 3–4 years data.
Comparison of stablecoins
USDT has the largest market capitalization of all stablecoins. Our data taken from investing.com begins from 2017 April.
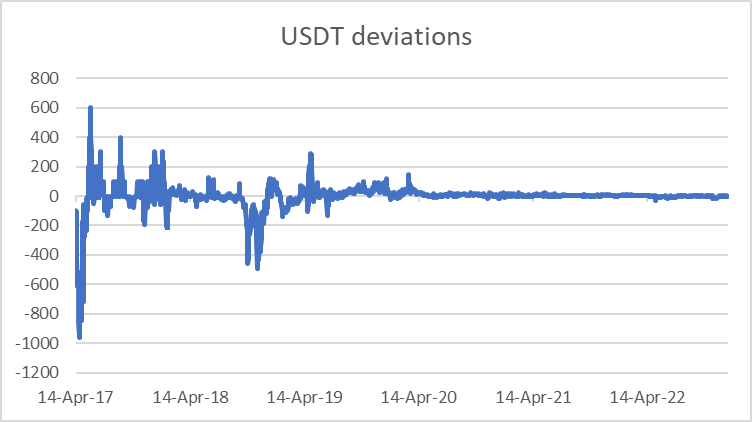
The chart above displays the deviation of USDT from the peg in basis points. Note that 1 basis point (bp) equals to 0.0001. So, if USDT price is 1.0095, it means that deviation is (1.0039–1) * 10,000 = 39 basis points.
The standard deviation of USDT movement is 95 bps. The time series also displays negative skew and high kurtosis. Skewness is a statistical measure of the asymmetry of the probability distribution which can also be interpreted as a measure of how values are distributed around the mean. Negative of left skewness of the financial time series indicates that it is more likely to experience many small gains and occasional but large losses. It is not desirable for financial time series to exhibit left skewness because rare big losses can and likely will cancel out small gains. If we accept the past as a guide to the future, it implies that USDT is likely to trade at a significant discount to the peg occasionally which can result in large losses for investors holding this stablecoin.
Kurtosis is a measure of the “tailedness” of “fatness” of the probability distribution. If the distribution of a random variable has a large kurtosis, it means that there are more data in the tails than in comparison to the normal distribution.
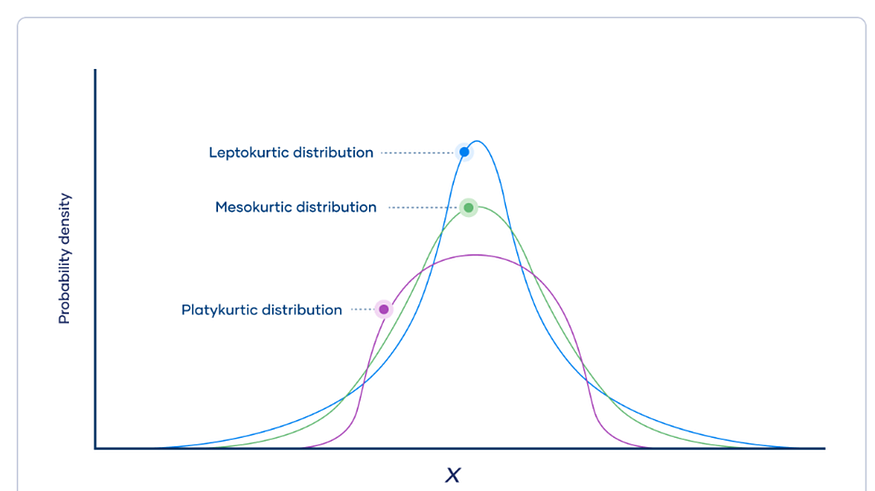
Distributions with the kurtosis higher than 3 are fat-tailed or leptokurtic. In these distributions outliers are more frequent. For a financial time series, a larger kurtosis than that of the normal distribution indicates there have been many deviations from the mean. USDT deviations from the peg have a very large kurtosis of 34 from which we can conclude that it may experience extreme price fluctuations in the future.
If we exclude the recent turbulent period of 2020 March, kurtosis of the USDT price fluctuations from the peg falls to 3. Though this is not as high as 34, we can confidently say it’s still a fat-tailed distribution.
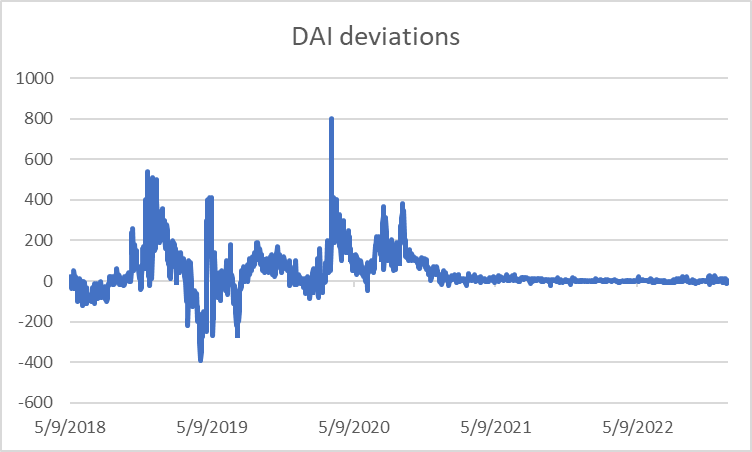
DAI is a stablecoin developed on the Ethereum blockchain. Since it has a soft peg to the US Dollar, it can be expected to display more deviations from the peg. Data confirms our hypothesis — the average deviation of USDT is -1.8 bps while for DAI it’s 39 basis points. Standard deviation of DAI price fluctuations with the value of 97 is also slightly higher than that of USDT. However, the kurtosis of DAI deviations is much lower than USDT but it’s still a leptokurtic distribution with the excess kurtosis of 6.
Another centralized stablecoin is BUSD which is 1:1 USD-backed and issued by Binance in partnership with Paxos. BUSD price data obtained from investing.com starts from 2019 September. BUSD fluctuated from the mean in 2.5 bps on average throughout the period. Its standard deviation equals to 16 bps which is lower than that of USDT and DAI. For a centralized stablecoin which is used on (almost exclusively) one blockchain network it is not surprising.
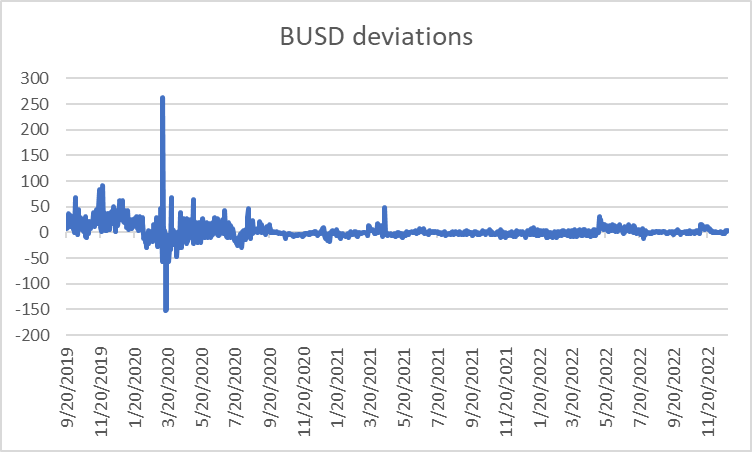
The interesting point here is that both the maximum and minimum deviations occurred in 2020 March during the Covid-19 selloff. On 12th March BUSD was trading at a premium of more than 260 bps while 5 days later the stablecoin was under the peg with the discount of -150 bps. A likely explanation is the following. First, investors panicked and sold their crypto assets into BUSD which increased the demand for it and pushed its price higher. Then, those funds were withdrawn from Binance. This massive sell-off decreased the demand for BUSD and its price plunged.
Kurtosis of the BUSD price fluctuations is extremely high, at 73. But if we exclude the whole month of March in 2020 and divide our data into two parts with the first one covering from 2019 September to 2020 February and the second one going from 2020 April to 2022 December, we get a different picture. Kurtosis values of these two periods are 1.3 and 9.1 respectively which is much lower than the original kurtosis of 73.
The distribution of BUSD deviation from the peg displays positive or right skew. Its positive skew is higher than that of DAI.
USDC
USDC is a centralized stablecoin with the second largest market cap after USDT. The stablecoin displayed wild swings between 2018 December and 2019 August. After 2019 August, USDC price fluctuations over or under the peg were relatively moderate. Even during the Covid-19 panic, USDC was less volatile than other stablecoins.
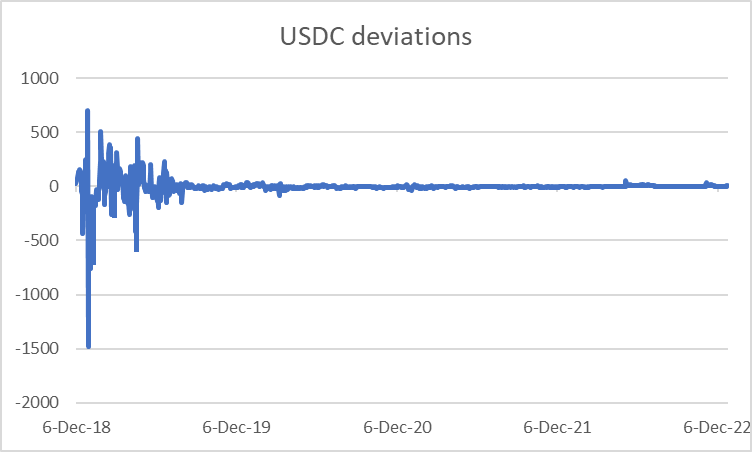
Standard deviation of USDC price fluctuations equals to 80, lower than that of USDT and DAI. If we exclude the more turbulent period between 2018 December and 2020 March, standard deviation decreases significantly to 7.14. This is more than 11 times fall in the dispersion of the data. The stablecoin has the most negative skewness of all stablecoins we look at with the value of -5.05. Kurtosis of USDC deviations also display the highest of all stablecoins with the value of 99. But again, if we look only at the period beginning from 2020 April, kurtosis equals to 7.47.


