
The crypto market has been very interesting this week and in a certain decisive way to test Bitcoin's ability to sustain itself above the strong resistance to which it was subjected in recent days in the band of $ 7500.
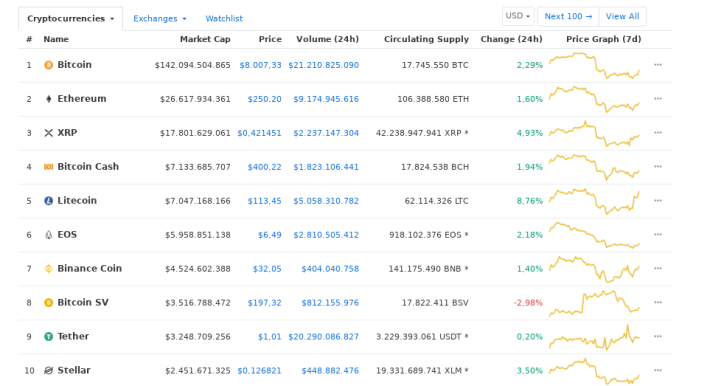
For now the market looks stable and with strong capital flow revenues again, which raise the MarketCap overall above the band of $ 255 billion, with BTC at the forefront dominating the scene with 55.5%.
![]()
Within the selective top ten, they all look green, with the exception of Bitcoin SV's proposal, which naturally is in correction after having enjoyed days of excellent performance.
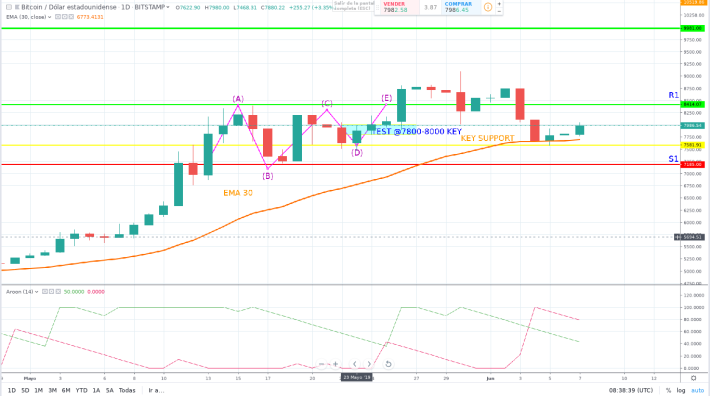
BTC fully complied with our latest forecast, managing to stay above the key support band, which was reached in a couple of opportunities and drastically drawing a Triple Wave Elliot that marked the roadmap of the main cryptocurrency asset.
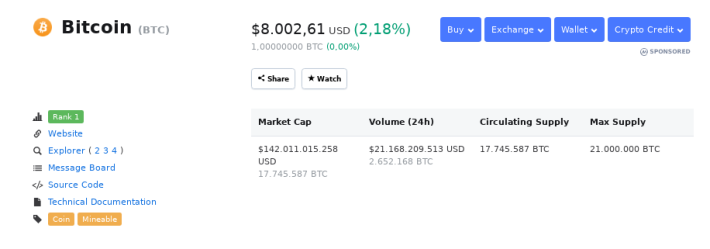
At the time of writing BTC quotes at a spot price of $ 8002.61 with a positive performance in the last 24 hours of + 2.18% and a market capitalization of over $ 142 billion dollars, with BitMex contributing 13% of the market share with its derivative products.
Now, in the short term, the cryptocurrency looks quite solid, with strong support created in the line of $ 7700- $ 7800, and everything seems to indicate that in a couple of hours it will be again stable above the 8k band.
The pattern of BTC begins to be ascending, after falling to levels of 7500 and has formed an isometric triangle that has its break in the value of $ 7769.97, which could be the average price that BTC would arrive in the next hours if it fails to exceed the top stop.
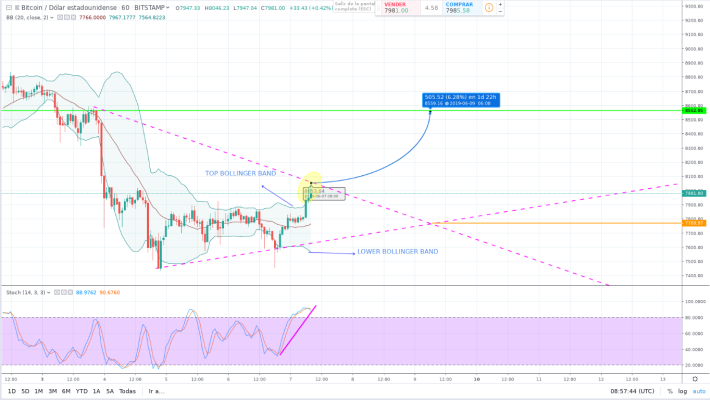
BTC however, looks at this moment totally safe to break the upper limit and everything seems to indicate that it will arrive in couple of days without any problem at the level of immediate resistance set at $ 8562.95.
If the last sails that we are observing manage to break the bollinger upper band, it could be the ideal moment of entry for a long strategy, with an estimated profit of 6.28%.
If on the other hand it falls below the lower band of Bollinger, in the worst scenario, we must redesign the strategy to shorts to emerge victorious.
The Stochastic indicator is bullish at all times with a steep slope that indicates the purchase pressure on BTC that will end up pushing its prices once again.
In the medium term, the outlook is even more optimistic for BTC. After suffering the ferocious downward attack so that the 'whales' can buy and accumulate at low prices, it seems to be the moment of entry for capital to be injected and prices pushed up again.
The triangular pattern presented by BTC is exactly identical to the one plotted in 2017 between the months of June-July of that year, just before the bull run of BTC at historic maximum levels, as Lisa Edwards influencer reviews in her tweet.
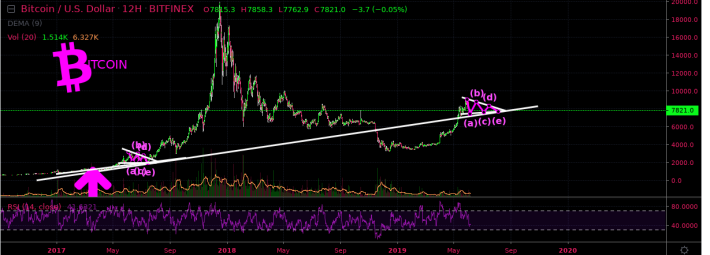
Considering the similarity of the pattern presented, the increasingly high levels of support achieved by BTC, the increase in FOMO and the widespread adoption of the blockchain technology, in addition to the short time remaining for the next halving, it seems that the real rally BTC bullish is about to arrive and that it will reach new historical highs judging by the support higher than that of the year 2017.
For now, BTC must break the triangle and complete the Elliot wave projected above the midpoint, which at the time of writing seems to achieve earlier than expected, according to the cut at the 'D' point of the wave with the top superior of the triangle.
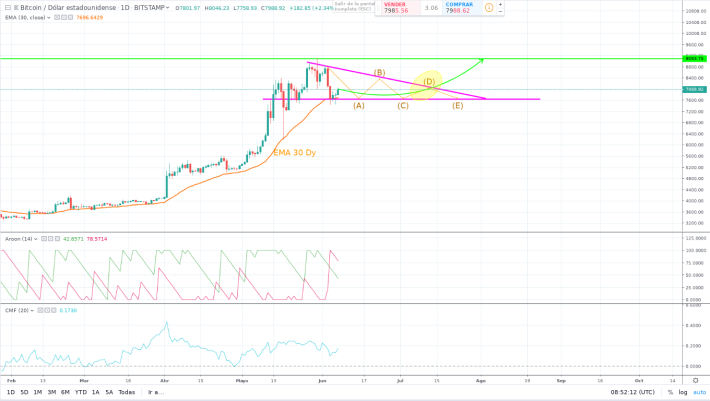
EMA 30 Dy is the key support now for BTC and is presented at higher levels than in past periods.
Aroon begins to show a bearish trend change, with Aroon Dowtrend direct to the bottom of the chart.
To make matters worse, CMF begins to give signals of capital injection to the BTC ecosystem and the market in general, which is now more robust and mature thanks to its average levels of MarketCap that are above $ 250 billion dollars, almost twice the average of a couple of months ago.
In conclusion, BTC both in the short and medium term is projecting an ideal entry level to obtain profits in its strategies. Everything seems to indicate that the crypto winter was finished once and for all for the main reference of the crypto ecosystem.


