
Hey Folks. I got my eye on a possible trade setup for Cardano (ADA) on the Day Chart.
As of right now, I am in a Long Position in Cardano, but the Long trade setup in my opinion is to late to enter long on Cardano, for the Risk/Reward would not be in my favour. So, the possible trade setup on the Day Chart below is for a possible Short Entry on or near the Golden Pocket using Fib Retracement Tool. I would like to see Price Action Reject off Golden Pocket to get a good Entry Price, increasing my Risk/Reward in my favour, by allowing me to set my Stop Loss just above the Golden Pocket.
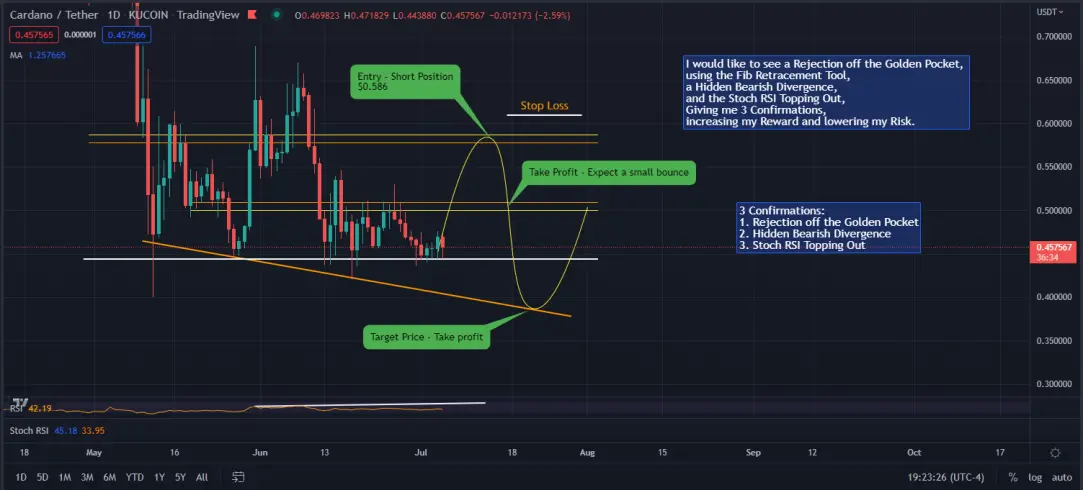
Before entering the possible Short Trade Setup, I would like to see some Conformations. The more conformations received, the higher the probabilities are in my favour. I got my eye on 3 Conformations, but two Conformations will be enough to enter trade. But the two Conformations I need to see before entering, is the Rejection off Golden Pocket and Hidden Bearish Divergence on the RSI. The Stoch RSI isn't as important to me, but would like to see the Conformation as well.
Note: If Price Action Fails to generate at least 2 Confirmations, I will not enter Trade.
3 Conformations
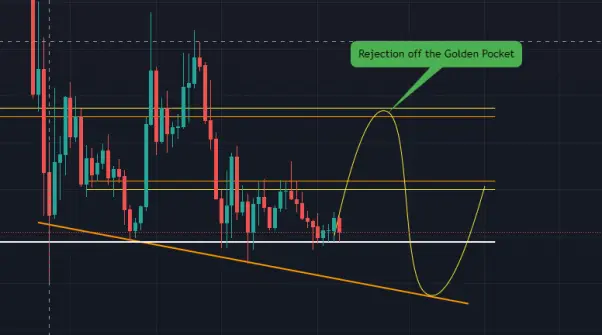
Conformation 1 - Rejection off Golden Pocket
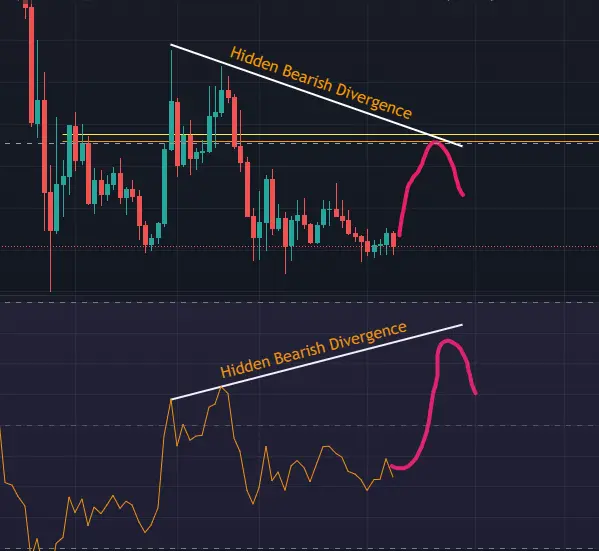
Conformation 2 - Hidden Bearish Divergence on the RSI
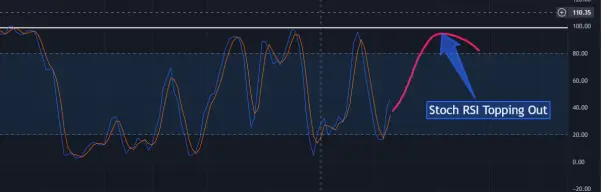
Conformation 3 - Stoch RSI Topping Out
Stop Loss - Daily Candle Close Above Golden Pocket.
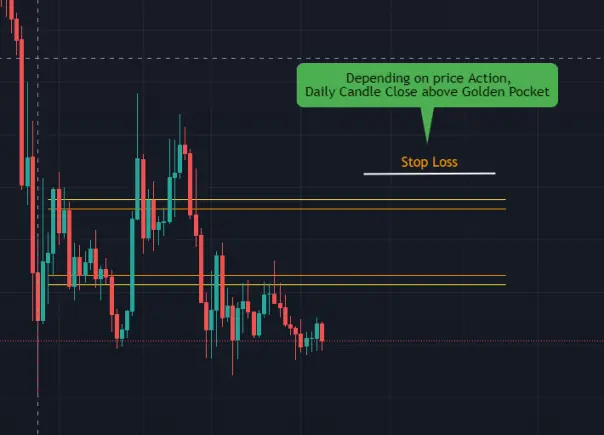
I will take Profits at Support (Trendline), and depending on price action I may close entire trade, or let the rest ride for long as possible, while moving my Stop Loss as Price Action falls, insuring profits. But Markets can change at anytime, and depending on price action, I may revaluate my position. Nothing is set in stone. For no trader can predict the markets. The best that traders can do is to determine the probabilities in which direction it will go.
Note: This trade is a Swing Trade. Anywhere from a couple days to a week or two, possibly more.
It is important to note, the trade may not materialize. Not Financial Advice
Please Take Note: Price Action on Day Charts can take some time to play out. Anywhere from a couple days to couple of weeks.





