
Bitcoin had a burst of volatility yesterday, just after the intersection we discussed in the previous article.
We briefly went below the bottom green line at $9210 which got me worried but we quickly bounced back up and we are now heading up in a sort of a channel.
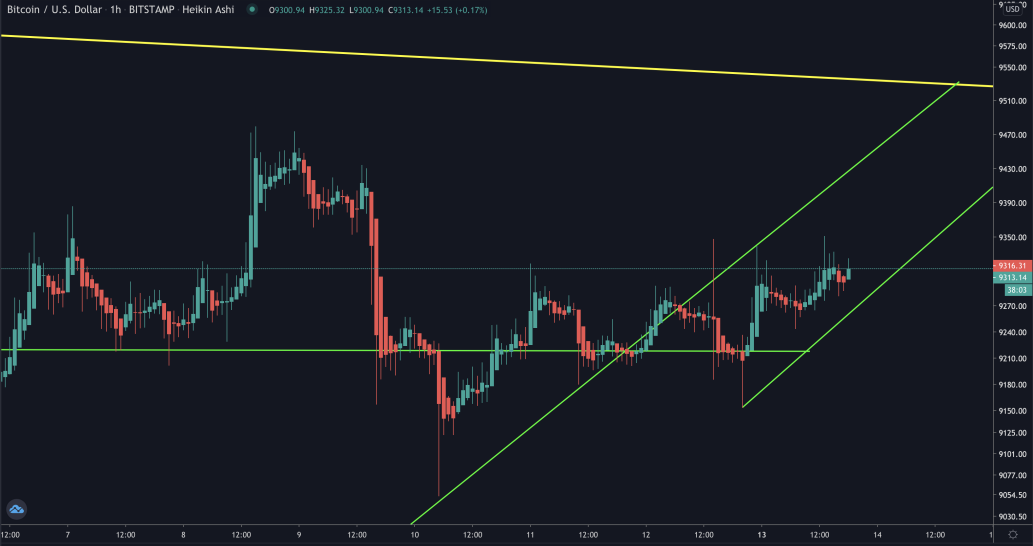
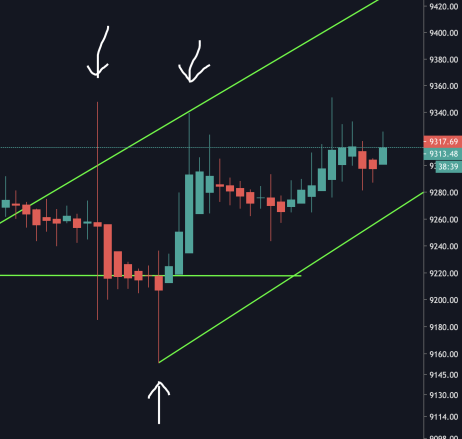
Excluding the first arrow from the left (showing the high volatility and indecision of the market) we saw another two important points that suggest to me we are now in this upward channel.
Interestingly, the third arrow from the left touched exactly the green line I placed in the chart two days ago.
Zooming out to the 4 hour chart I've also loosely identified another and less steep uptrend in light blue.
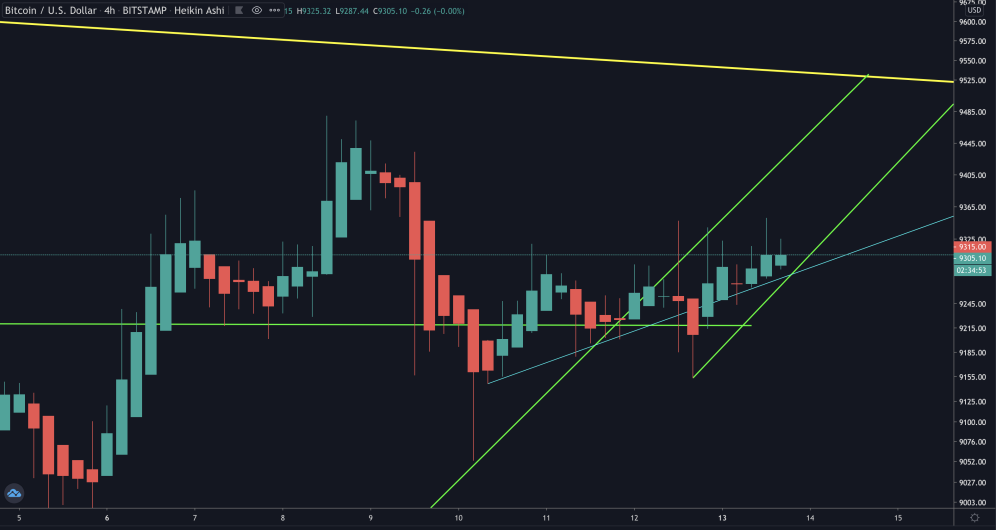
Still on the 4 hour chart I can see a potential triangle formation as well, added in light blue below.

Based on all the above, I'm expecting some large movement in the next 48 hours. Either below to the $9200 level or above to the $9400 level.


