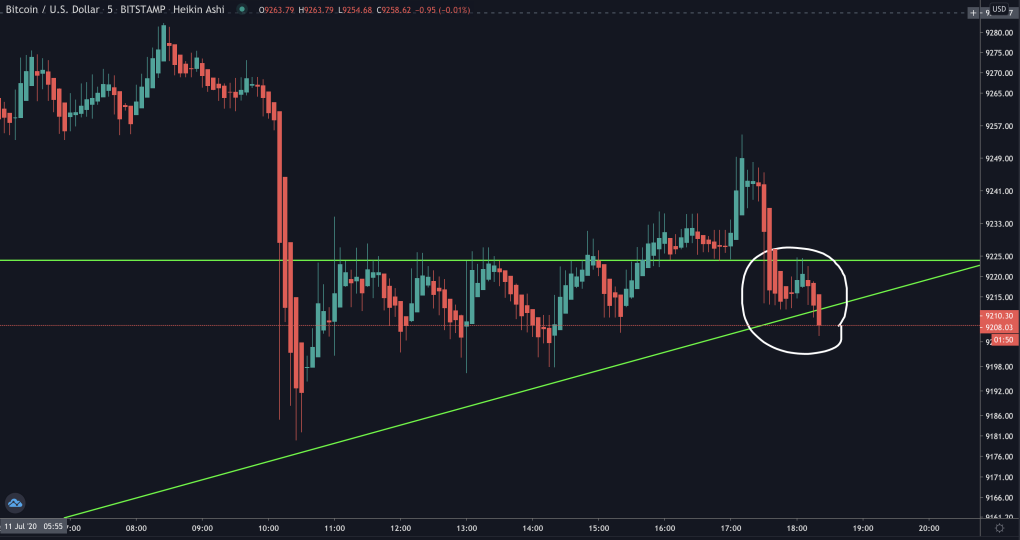
We are at a crucial point in the chart where Bitcoin price is now at the intersection of a horizontal support/resistance and an uptrend support.
I rarely go to low time frames in the chart, but I want to show you how the price is bouncing between the two lines and now sitting below the uptrend support, which is not a good sign.
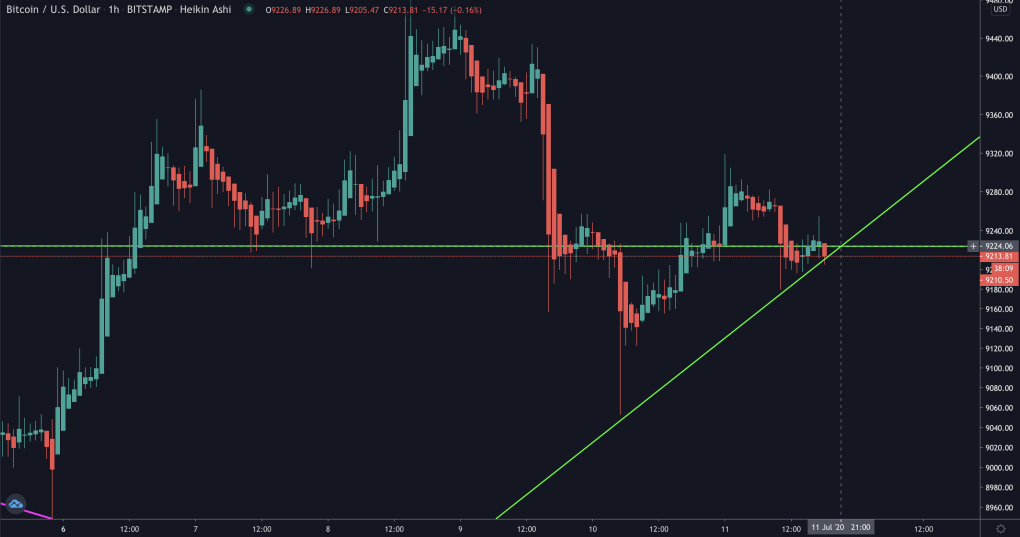
Zooming out to the 1 hour chart, we can the intersection better and we are very close to reach it. Although the weekends are generally quiet in terms of price movements, I'm expecting a sizable movement soon.
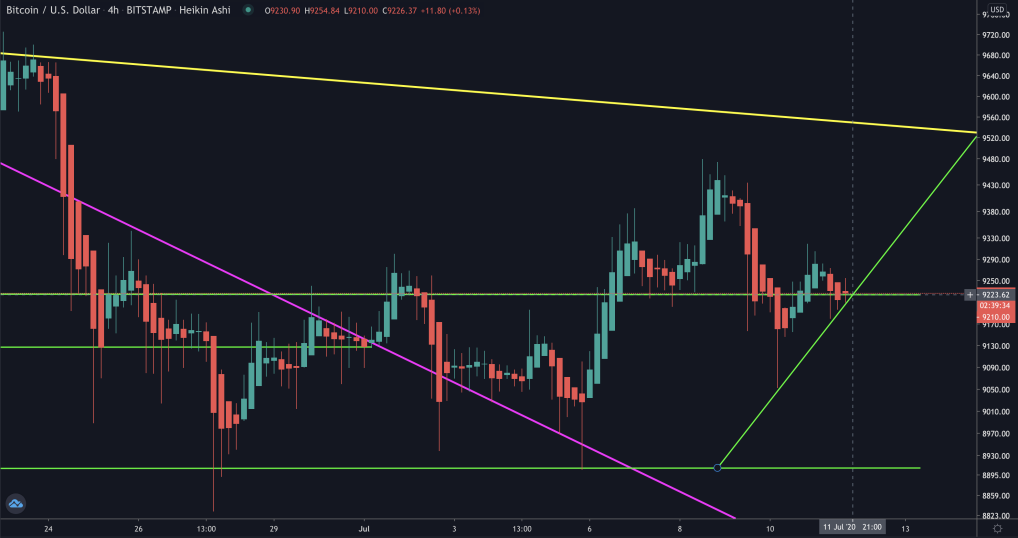
Zooming out to the 4 hour chart we can appreciate the current environment better. In the past few weeks we were bouncing off the bottom green line support and we recently started an uptrend toward the long-term downtrend yellow line.
There is a good chance next week we will see a lot of volatility, which is exciting after such a long time of sideways movement.