
The crypto market never repeats itself perfectly…
Yet the sound matches perfectly.
Right now, Bitcoin’s weekly pattern looks a lot like the sharp peak seen before the 2021 drop - a moment that sparked last year's downturn. Step by step reveals how close today feels to back then.
Here comes a familiar rhythm in how things spread - echoes of what happened before start showing up again.
Market Peak 2021 Double Top And Lower High
In 2021 Bitcoin emerged
A peak that didn’t reach as far this time, seen over seven-day blocks. The rise stalled just short of last week’s mark
Followed by a sharp sell-off
A retest rejection
And then a massive breakdown
This spot shows up right away because of the white line going down.
That precise setup had quietly signaled the peak before it happened.
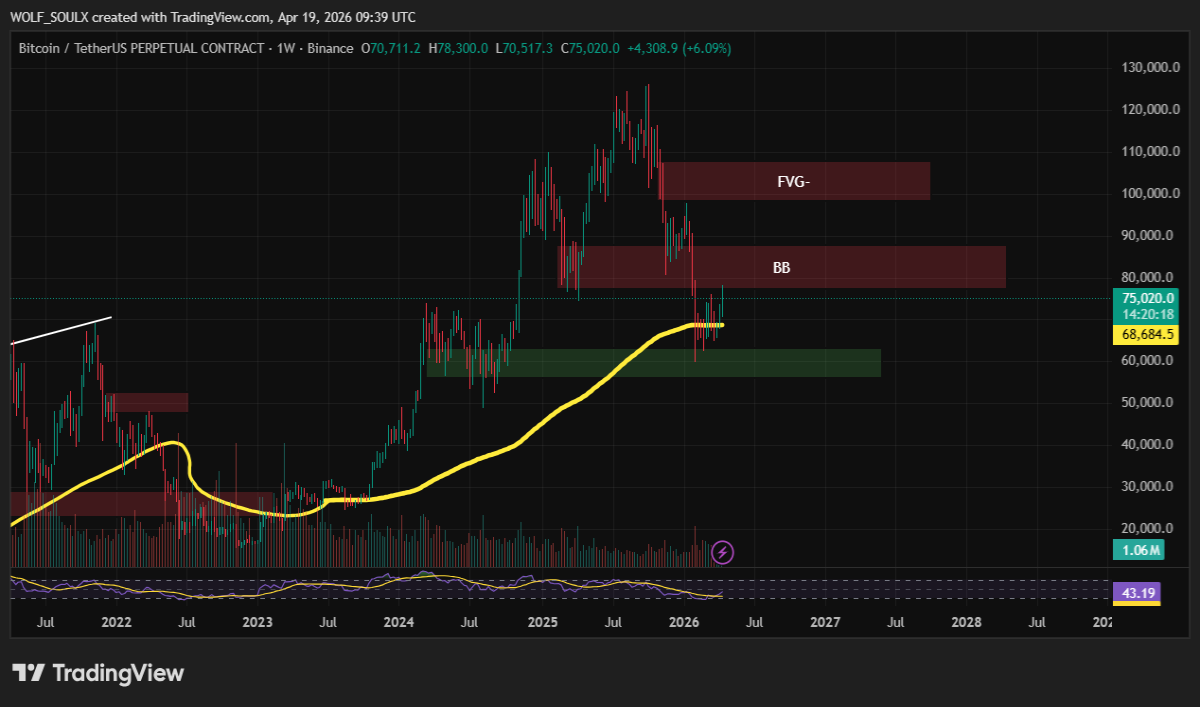
Market Structure In 2026 Resembles Past Patterns
Take a look at how things are built now
A fresh low peak shows up this week, following the break above earlier levels
Resistance held firm near higher price areas, where fair value gaps met Bollinger Bands. Pressure faded once levels aligned. Price turned down after testing those points. Overhead supply stayed intact through that move. Reaction followed soon afterward. Zone strength showed clearly at that moment
Price touching the weekly 200 EMA-like yellow curve
One person grabs a spot, another follows close behind in the same broad area where needs overlap
Right now, the initial rebound looks just like the one back in 2021. Though months apart, they match closely in shape and timing. This move feels familiar, not new. Much like before, prices lift suddenly after a drop. One difference might be context, yet the pattern repeats anyway. Even so, history doesn’t always predict what comes next. Still, similarities stand out clearly.
🟩 2. Demand Zones Match Exactly
2021 Demand Zone Green Block
After BTC dropped in 2021, bounces kept appearing - each time near the same weekly demand level. That support held firm at first, though not forever. Finally, price moved below it.
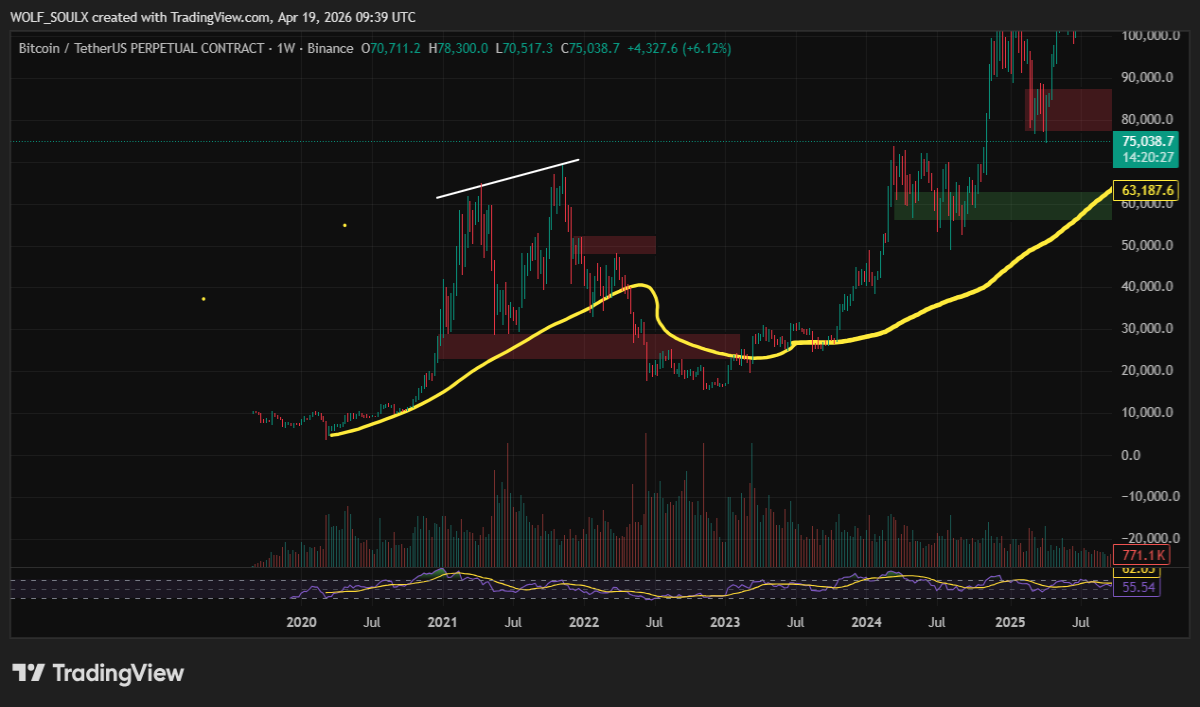
2026 Demand Zone Green Block
Your second graph displays:
BTC nearly touched a demand zone with similar layout. This spot held before, might again. Price drifted close without breaking through. Past reactions suggest support here matters. Action remains quiet but watchful near this level
Strong bounce after sweeping liquidity
A weekly bullish recovery candle forming
This time last year began just like that - pressure stayed strong at first, only to fade when weeks passed.
Right now, demand moves just like before.
📊 3. Mid-Cycle Correction Before Final Macro Rally
There is a long-term pattern in Bitcoin cycles:
Bitcoin tops → deep correction
Retests long-term moving averages
The last curved part moves next
BTC pokes at major moving averages between runs - your yellow curve captures that moment just right.
Just like in:
2017 → 2018
2021 → 2022
By next year things shift forward one. Time moves on without asking. Into 2026 everything lines up again slightly different
This moment feels familiar, yet everything has shifted. Moving forward without fanfare, change creeps in quietly. Each step taken like the last, though ground differs. Here we stand, not by choice but rhythm. Same air, new weight beneath it.
🟥 4. The Same Supply Zones Are Blocking the Breakout
Your chart marks two major red zones:
FVG (Fair Value Gap)
BB (Breaker Block)
Back then, Bitcoin kept bumping into heavy resistance. Each attempt fizzled out fast. After a string of misses, the price gave way completely.
Currently:
BTC is again below a multi-month supply zone
Almost the same way it gets turned down every time
Right now, feelings in the market seem unchanged
It's like running into the same barrier again. One that doesn’t move, no matter how hard we push.
💡 5. What This Means for the Market Now
One way to see it leaves room for two versions of events. Each fits what actually happened back then
Scenario A Bearish Echo Of 2021
If BTC bounces off BB–FVG areas once more
A drop might hit hard. Things may fall fast. A steep dip could show up. Downward motion seems possible. Sharp falls sometimes happen. Sliding lower appears likely
Liquidity sweep below demand
Longer consolidation before next bull leg
This follows the route taken between 2021 and 2022.
Scenario B 2020 Style Accumulation Breakout Bullish Echo
If support continues holding above the moving average:
BTC could break the BB zone
FVG gets filled
We push toward a new macro ATH
Back then, things looked just like they did in 2020 right before jumping to 69K
.
📌 Final Thoughts: “History Doesn’t Repeat, It Rhymes”
Looking back at 2021 feels a lot like watching today unfold in 2026. Though separate moments, each carries nearly identical shapes. One mirrors the other, not by chance but pattern. It's hard to ignore how closely they align when seen side by side. What happened then seems to echo now with little change
Lower highs ✔️
One more time, that exact same area where buyers stepped in ✔️
Same moving average retest ✔️
Same distribution-style rejection ✔️
Same liquidity sweeps ✔️
Betting big on Bitcoin feels different right now. Weeks like this one tend to shift everything without warning.
How things unfold might hinge on what happens near the BB and FVG spots - will it echo 2025’s drop or mirror 2024’s surge? A shift could come from how traders respond right there, not elsewhere. Movement may tilt one way if pressure builds in those pockets early. What plays out in those areas tends to steer the broader course. Past turns suggest location matters more than timing. Watching tension form around those levels often reveals the next leg before it spreads.
History moves just like this before. Each step matches what happened earlier. The pattern repeats itself closely today.


