
⚡ Quick Takeaways:
-
The Event: Bitcoin (BTC) jumped over 2.8% in 24 hours, crossing $66,300 for the first time in over a month.
-
The Catalysts: A $226M+ reversal in spot Bitcoin ETF inflows, combined with $200M in short position liquidations and cooling US-Iran geopolitical tensions.
-
Key Levels: The $67,500–$68,000 zone is the major hurdle. A clean breakout open doors to $70,000+; a rejection sends BTC back toward $63,000 support.
-
The Verdict: Institutional accumulation is resuming, but derivatives volume is outpacing spot volume. Proceed with disciplined risk management rather than raw FOMO.
The $66,000 Recovery: What Just Happened?
After weeks of sluggish price action following a bottom near $58,000–$60,000, Bitcoin has surged back above the $66,000 mark.
This isn't just a random retail pump data reveals a classic confluence of institutional capital returning, a derivative short squeeze, and an easing of macro headwinds.
$70,000 --- (Ultimate Range Target)
|
$68,000 --- (Crucial Resistance Hurdle)
|
$66,300 --- [ CURRENT PRICE ZONE ]
|
$63,000 --- (Strong Structural Floor)
📊 Research Deeply 3 Drivers Behind the Rally
1. Spot ETF Inflows Break the Outflow Streak
Following heavy outflows throughout June, institutional flows via US Spot Bitcoin ETFs have flipped back to positive. According to tracking data from SoSoValue, spot ETFs logged over $226 million in net inflows in a single session, marking five consecutive days of green flows.
When institutional buyers like BlackRock’s IBIT and Fidelity’s FBTC turn net buyers again, it creates a structural supply sink that absorbs daily exchange sell pressure.
2. $200 Million Short Squeeze Triggered
Market participants who were betting heavily on a breakdown below $60,000 were caught off-guard. CoinGlass liquidation maps show that as BTC pushed past the $65,000 mark, over $200 million in short positions were liquidated across crypto exchanges within 24 hours. Forced buying by short-sellers further fueled the upward velocity into $66,300.
3. Geopolitical De-escalation & Risk Sentiment
Financial markets hate uncertainty. News reports from Reuters confirming regional mediation proposals between the US and Iran have helped ease crude oil prices and restore appetite for risk assets like Bitcoin and tech equities.
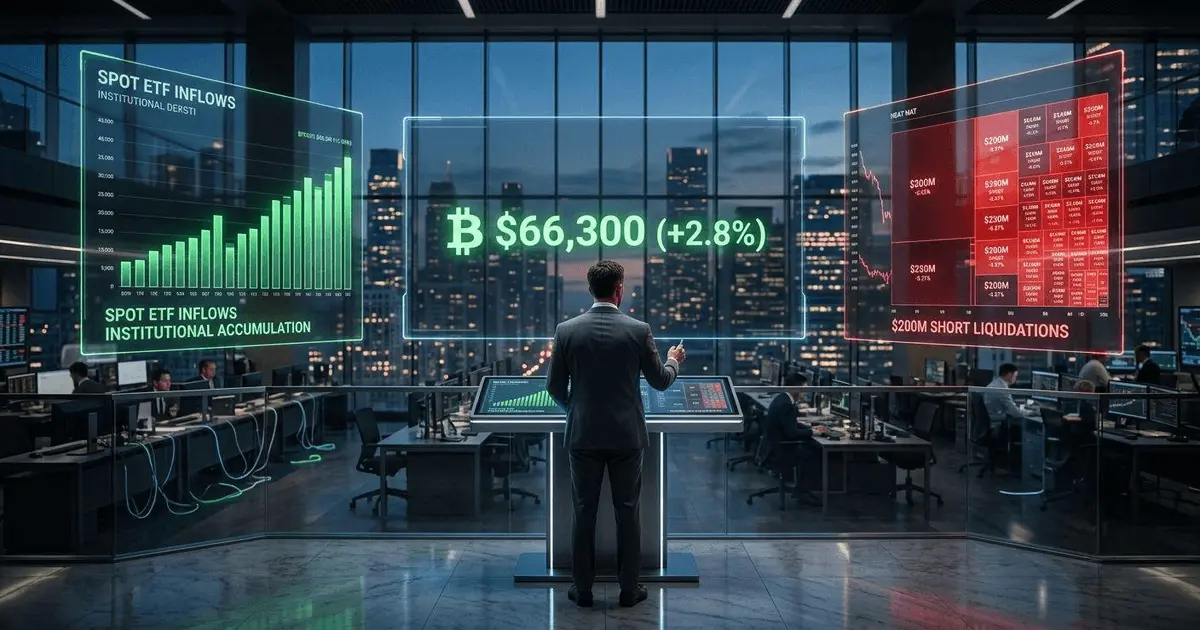
Professional analysis of Bitcoin market data.
📈 Technical Analysis: Is $70,000 Realistic or Is It a Bull Trap?
Looking at the daily chart, Bitcoin has reclaimed its key moving averages. However, traders must navigate two distinct scenarios before declaring a full-fledged bull run.
    [Scenario A: Breakout]                 [Scenario B: Bull Trap]
   $68K Reclaimed + Volume Surge        Rejection at $67,500 Resistance
                ↓                                   ↓
     Fast Rally to $70K                   Retest Floor at $63,000
Scenario A: The $70,000 Breakout Route
-
Resistance to Watch: $67,500 to $68,000.
-
The Setup: This price zone represents the lower bounds of the Q1 consolidation range. If Bitcoin can close a 4-hour or daily candle above $68,000 with strong spot volume, technical momentum will likely propel the price toward $70,000-$72,000 rapidly as sellers run out of supply.
Scenario B: The Fakeout / Bull Trap
-
Support to Watch: $63,000 to $64,000.
-
The Trap: On-chain research firm Glassnode warns that overall spot volume remains lower than Q1 levels, meaning this move is heavily driven by futures leverage. If ETF inflows stall and futures long positions become overly congested, whales could push a sharp rejection back to $63,000 to sweep open interest.
How to Play This Market (Actionable Strategy)
-
Avoid Chasing Green Candles: If you missed buying the $60K–$62K dip, opening market longs at $66,300 into major resistance ($67.5K) offers a poor risk-to-reward ratio.
-
Wait for Confirmation: Either wait for a clean daily close above $68,000 or look for a pullback/retest entry near $63,500 with a tight stop-loss.
-
Track ETF Flow Metrics Daily: Keep an eye on daily SoSoValue/Glassnode reports. Consecutive days of negative flows are your earliest warning sign of a momentum reversal.
On-Chain & Research Sources
This analysis is compiled using verified real-time institutional and on-chain metrics:
-
ETF Inflow/Outflow Data: SoSoValue & Bloomberg Terminal Data
-
Liquidation & Derivatives Open Interest: CoinGlass Analysis
-
On-Chain Volume & Holder Behavior: Glassnode Market Reports
-
Macro & Geopolitical News: Reuters & Financial Times Reporting
💬 Community Discussion Point
What's your play here? Did you buy the $60,000 dip, or are you waiting for $70,000 confirmation before entering? Drop your thoughts and price targets in the comments below! 👇
Disclaimer: This post is for educational and research purposes only and does not constitute financial advice. Always do your own research (DYOR).
⚡ Never miss an urgent market shift: I post daily real-time crypto setups, micro-analyses, and exclusive charts. Follow My Daily Updates Here
🚀 Duplicate CryptoVault Now: Grab your automated Notion Trading Journal here for 50% OFF with code LAUNCH26
👉 Stop trading blindly: Secure your CryptoVault on Gumroad now to master your risk analytics and protect your capital.





