
Technical Analysis
Long term - Weekly Chart
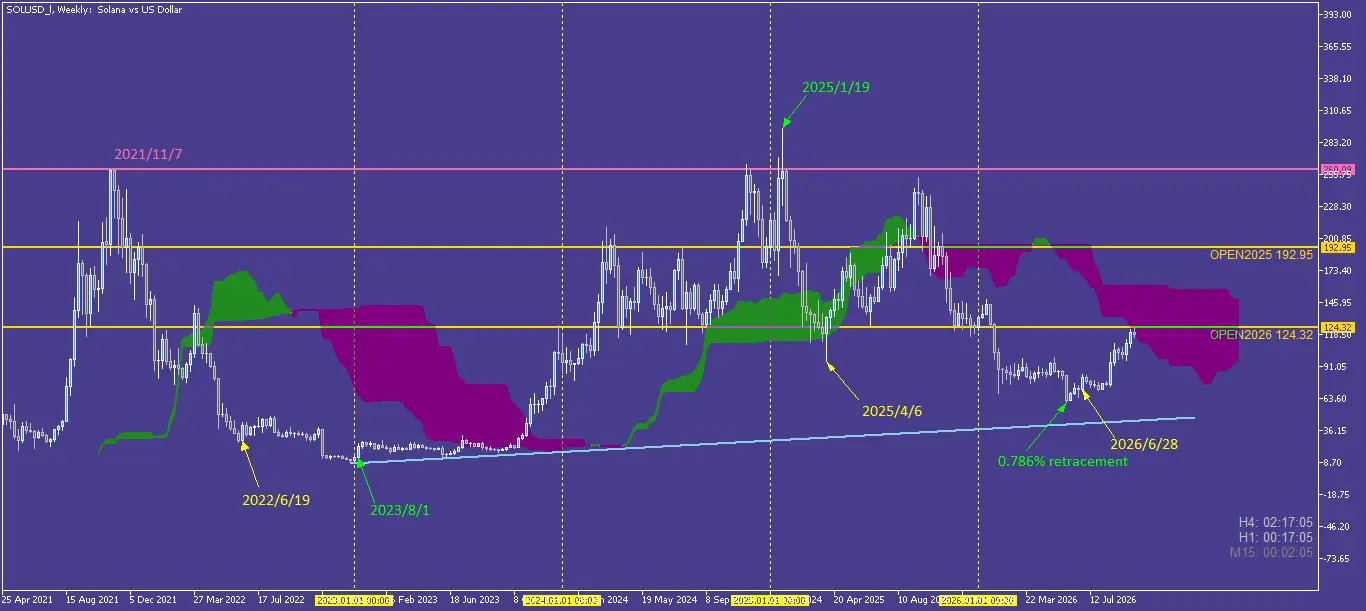
Following a nearly 2 year rally (2850% surge in price) SOL has spent a year and half correcting that sharp move to its historical top (0.8 of it was retraced). signs of trend reversal are slowly emerging. SOL has now reached a pivotal resistance 2026 open price level with a significant history. If you look ate the left side of the chart you can see that it has served an important role and weekly break and test usually will lead to price appreciation.
However we should never under estimate the possibility of another low and a test of the blue support line.
SOL versus ETH on weekly chart
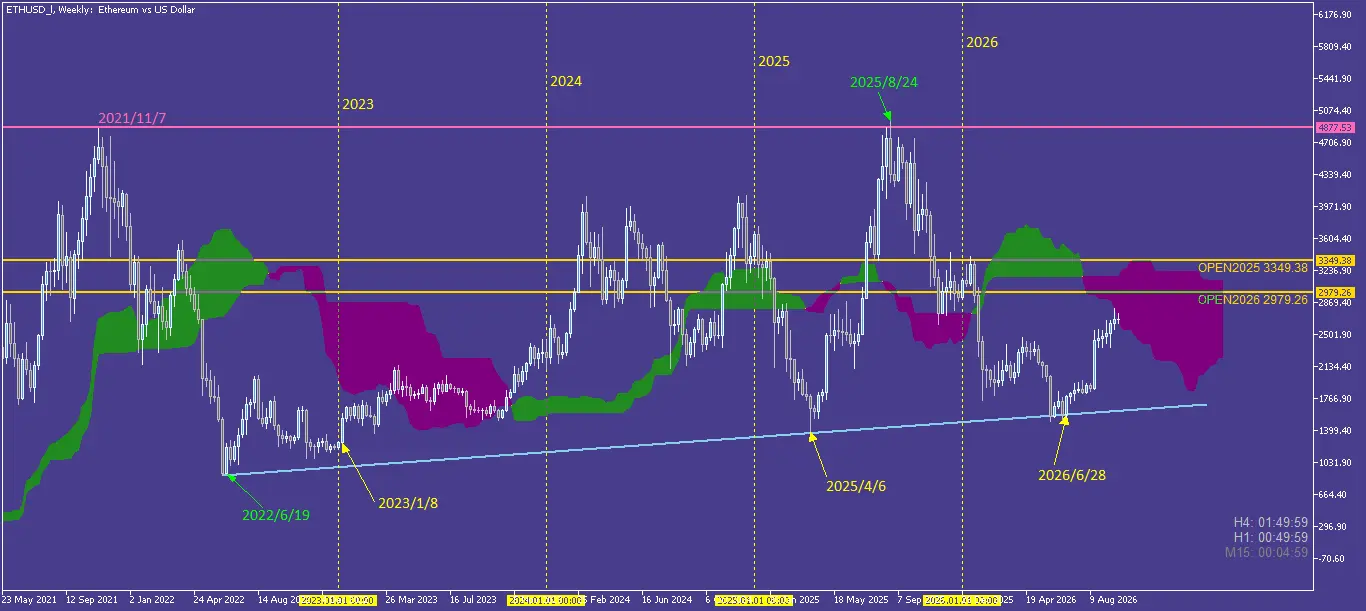
In this case the blue support line was tested for the third time and price has respected it, so we have a positive point here. if you look at the date 2022/6/19 ad compare it with SOLUSD chart you see the start if an up trend, here it led to 465% growth over 3 year period and a 0.85 correction. A more gradual growth of ETH with a slightly deeper correction in shorter duration.
Comparison with BTC weekly chart
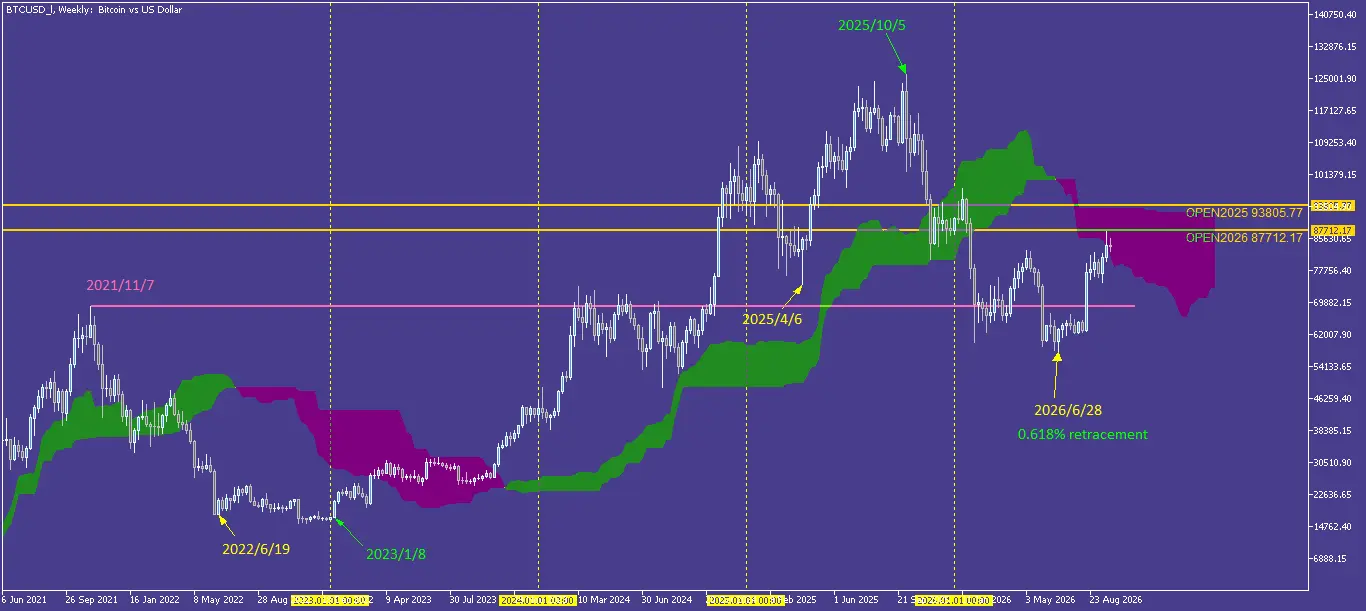
Bitcoin saw a 715% growth over slightly less than 3 years followed by a 0.618 correction just under a year. SOLUSD & BTCUSD has reaches 2026 open price level.
An interesting point in BTCUSD chart is the 2021/11/7 level, where SOLUSD and ETHUSD hit the wall and returned, bitcoin has a successful break out of this significant peak with a 80% move. Recently this level was broken with a large bearish weekly candle, followed by 9 weeks of overlapping candles within 13% price range, before the decline was taken back with a large bullish weekly candle. Interesting pattern, showing some major shift.
Long term analysis conclusion
All 3 assets hit their major lows at the same time , but reached their major tops at different times. ETH had established HL sooner and now it has tested its support line. Recently BTC has a very interesting price move.
All 3 has faced a thick kumo and 2026 open as a resistance (ETH sits only 10% bellow it).
Signs of a trend reversal and coordinated move can be seen. However I don`t except a sharp spike to break the resistance. we must watch shorter time frames for more conformation.
H4 time frame TA
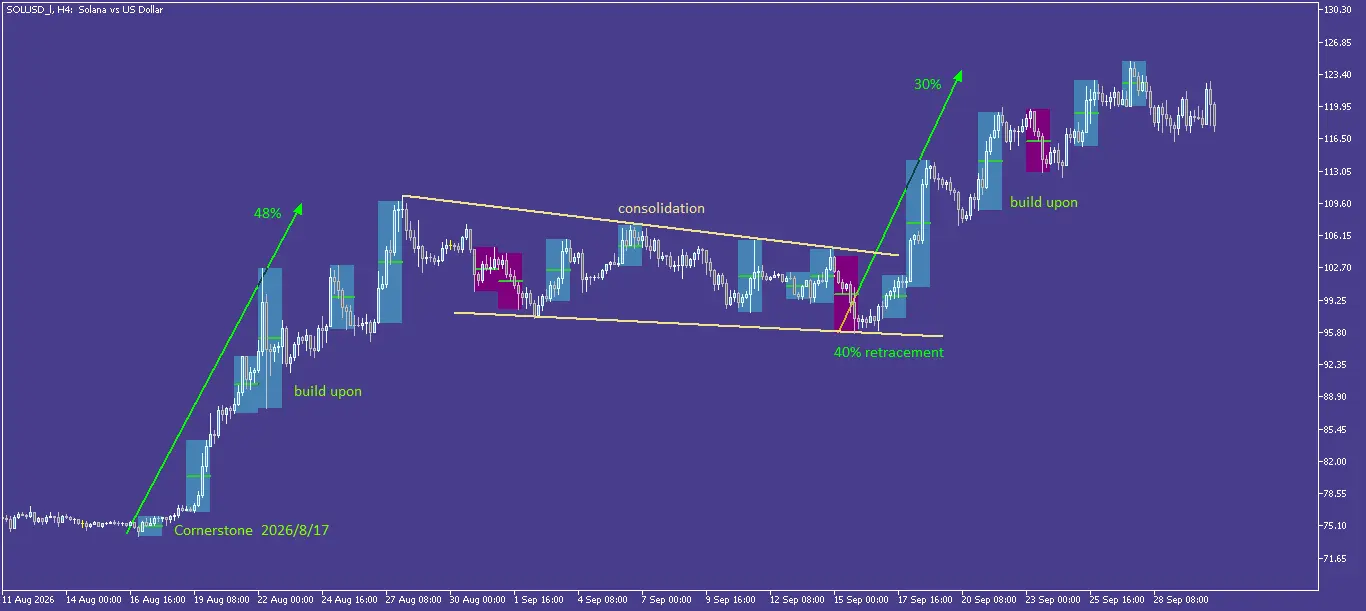
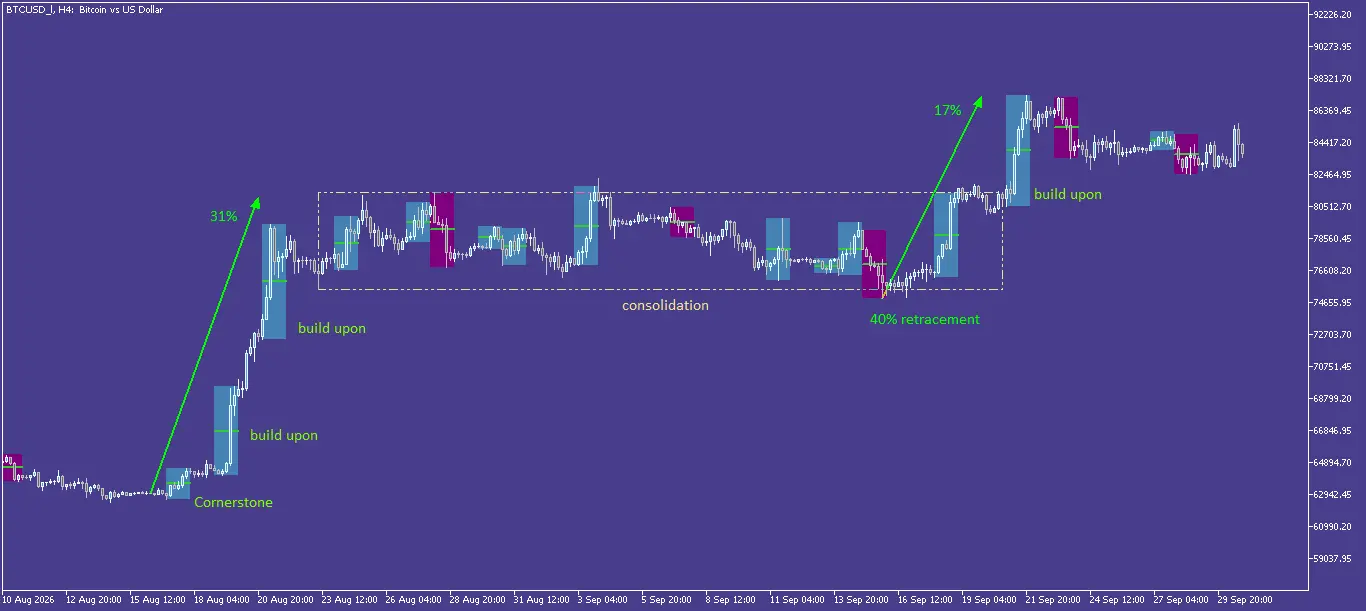
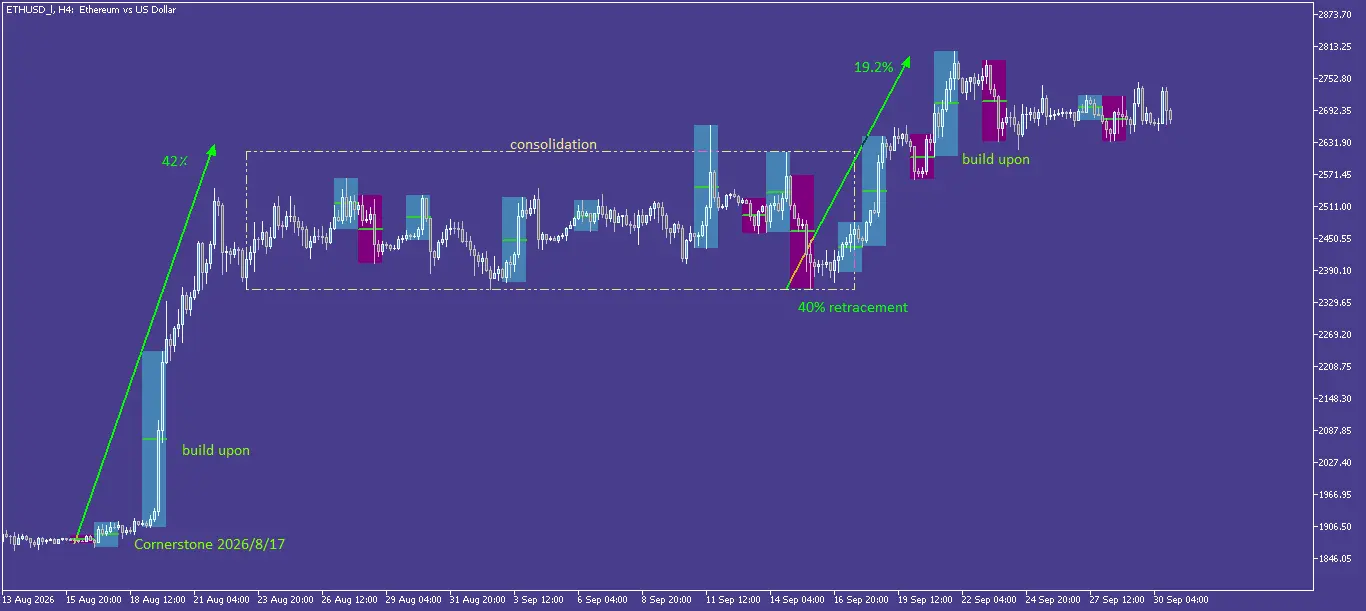
Formation of a bullish structure can be seen in all 3 charts, Two distinctive surge in price and a consolidation can be seen. Consolidation zone spanning approximately 150 candles with a 0.4 retracement of the first rally (30 to 40 candles). so in my opinion it is a valid zone and I will watch it carefully. Liquidity pools have formed around this zone and I except volatility around it.
Thank you all for your attention and good luck.
This article is foe educational and informational purpose only and dose not constitute financial or investment advice, always DYOR.






