
Navigating the crypto market requires a strong filter to separate actual blockchain metrics from fabricated internet hype. Currently, retail traders are facing an overwhelming wave of conflicting information. While various digital platforms are buzzing with speculative theories regarding a massive structural bull run, the actual movement of institutional capital on the blockchain presents a vastly different reality.
A prime example of this digital noise is a widely shared post claiming the official passing of a crypto legislative framework known as the Clarity Act. The post went viral by showing a document marked with a bold green approval stamp to validate a sudden market surge. However, a closer look at the actual government filing reveals that this bill, officially registered as S. 2019, focuses entirely on administrative procedures within the White House executive mansion. It contains absolutely zero clauses about digital currencies, Web3 tech, or monetary policies. This serves as a stark reminder of how easily public records can be manipulated to trigger artificial buying panics.
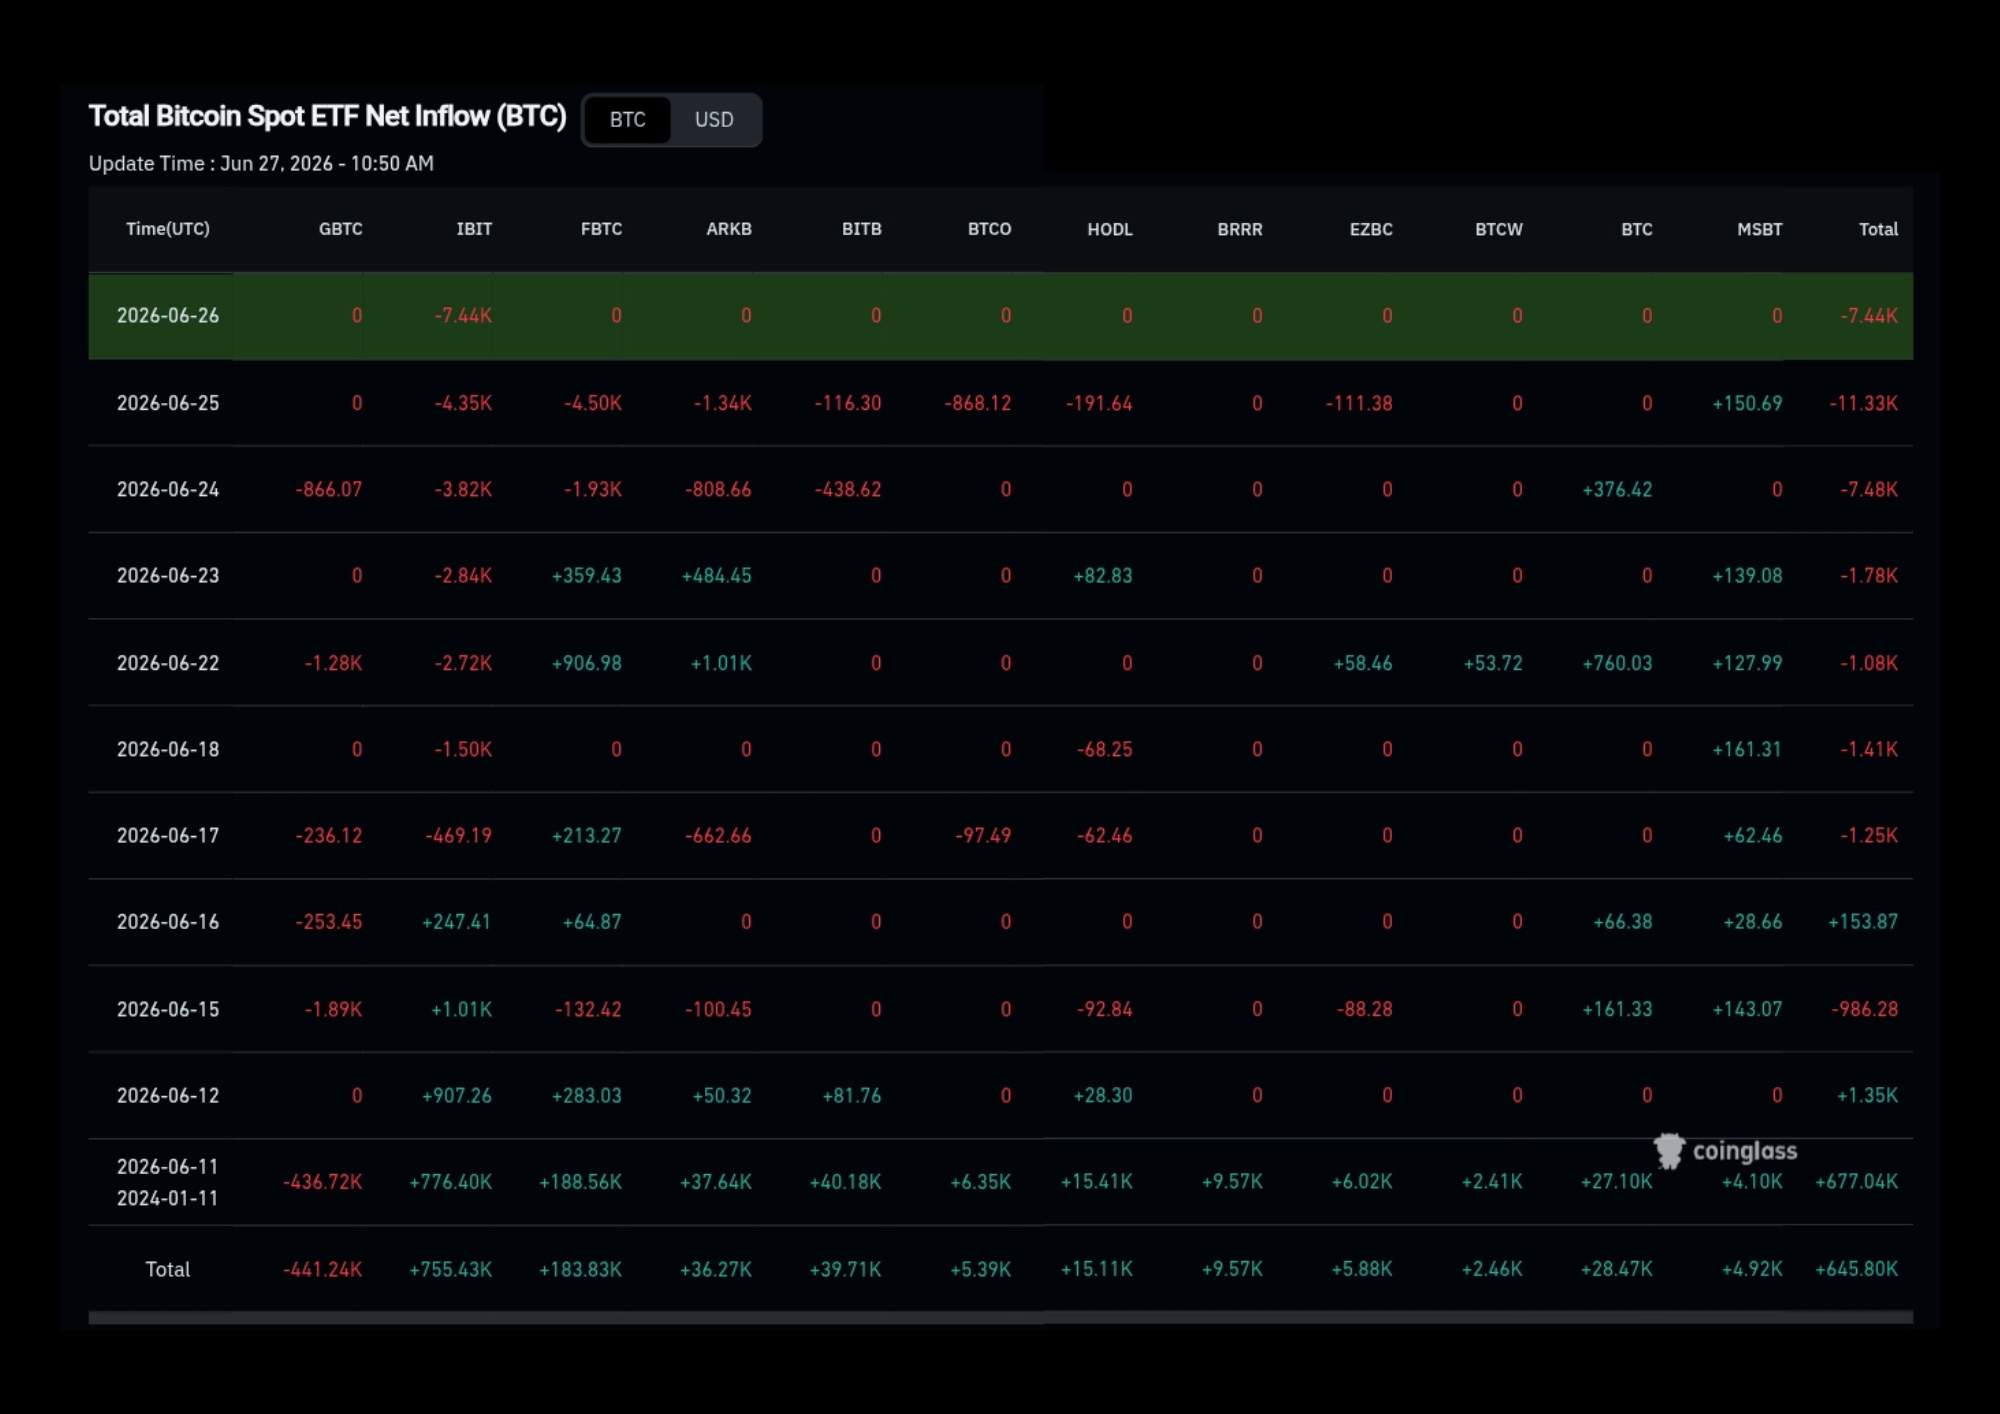
When we turn our attention away from social media feeds and focus purely on regulated financial products, we can observe a much more grounded market behavior. The spot bitcoin ETF ecosystem in the United States recently experienced its most intense period of capital flight to date.

During a single week of trading, institutional funds witnessed a staggering net outflow totaling $1.79 Billion. A massive portion of this selling pressure originated from BlackRock, as their flagship IBIT fund alone accounted for roughly $1.3 Billion of the total capital withdrawn. This aggressive reduction in exposure indicates that major fund managers are actively de risking their portfolios in response to broader macroeconomic shifts.
The depth of this institutional sell off becomes even more evident when analyzing the daily breakdown of fund flows, where red days have become a consistent pattern without any significant buying interest to absorb the liquidations.
This risk off approach is highly visible across major derivatives exchanges as well, with futures market heatmaps showing a heavy wave of long liquidations cascading through the system after Bitcoin slipped past key psychological baselines.

From a pure chart perspective, the overhead supply is heavily concentrated with the highest resistance zone established between $90.280 and $88.400. Furthermore, a secondary barrier has formed around the $74.265 - $73.060 price range. Right now, the market is aggressively testing the resilience of its lower structural foundations.
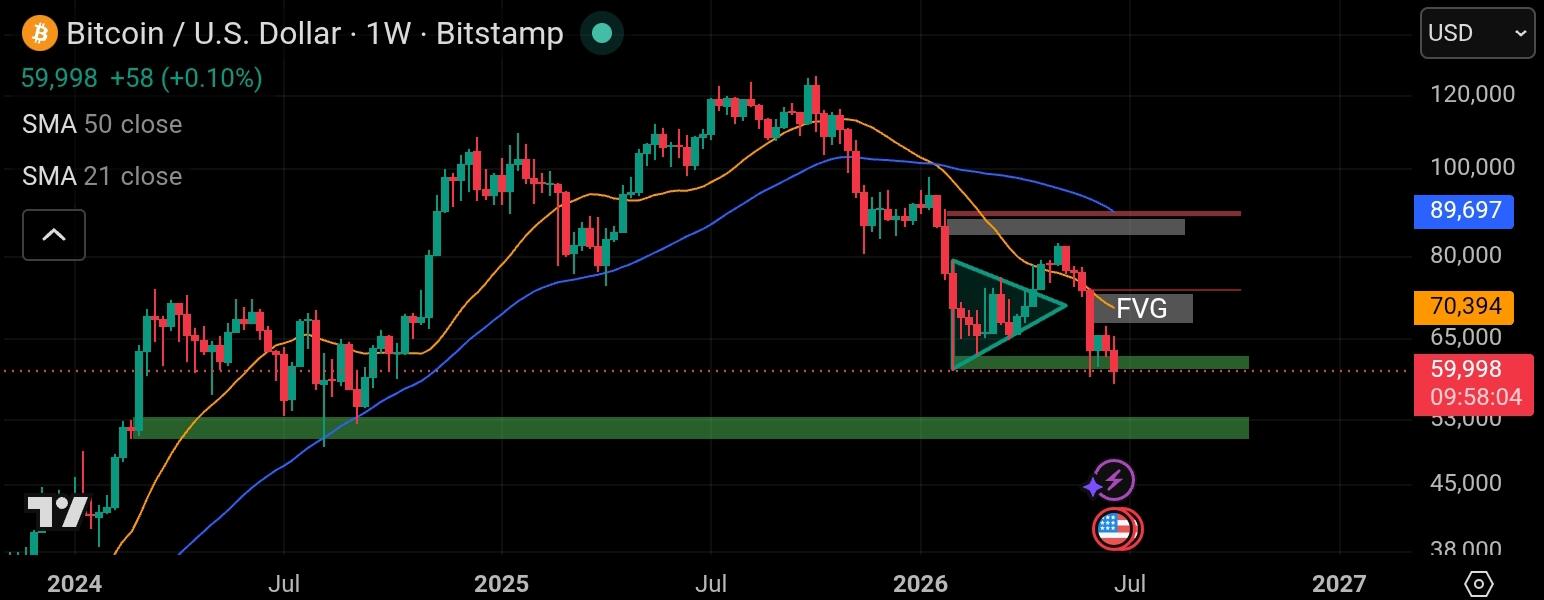
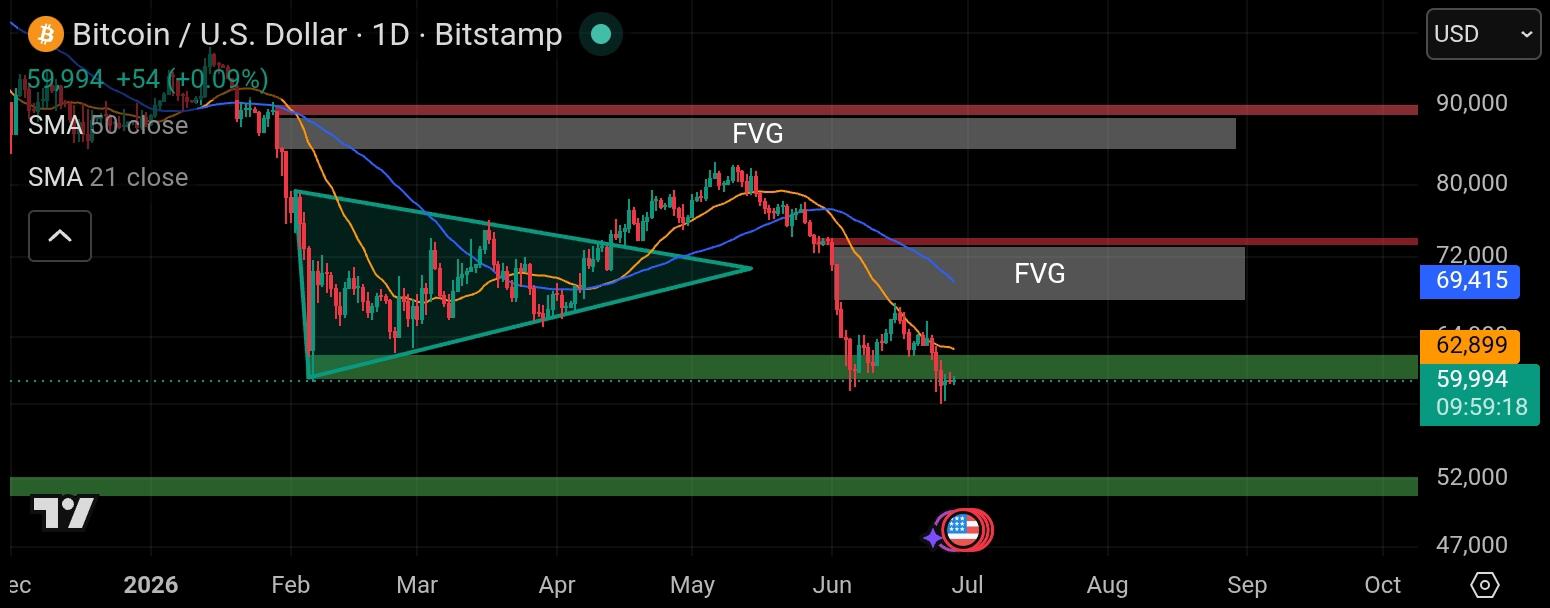
Given the sheer scale of recent institutional distributions, the current support floor ranging from $62.560 down to $60.000 is under immense stress and could face a potential breakdown. If Bitcoin fails to defend this area and prints a daily candle close below $59.900, the immediate bullish structure will likely invalid. A deeper continuation of this downward momentum would push the price toward the next historical accumulation node between $52.290 and $50.520, representing a vital macro demand zone that must hold to protect the macro uptrend.
My Opinion
The convergence of aggressive ETF liquidations and sticky macroeconomic data like elevated inflation reports makes this short term market correction highly logical. Higher inflationary pressures typically force central banks to maintain restrictive interest rates, which naturally incentivizes large institutions to rotate capital away from volatile assets into fixed income yields. This prolonged state of regulatory and macroeconomic suspense is precisely why fabricated policy rumors gain traction so quickly. Anxious retail investors are constantly searching for definitive answers, making them highly susceptible to engagement bait narratives circulating online.
Click here to read my authentic and original analysis
Source


