This study aims to make an analysis of the bitcoin price variation in the short and medium term, taking into account the graphic analysis and the logic behind the bitcoin mining after halving and the fall in inflation.
Why will bitcoin fall after halving?
In a quick and simplified way if you don't already know, halving cuts in half the amount of bitcoins that is emitted for each block mined.
This causes a price deflation because they are generating less bitcoins and the law of supply and demand less bitcoins being generated and more people interested in the asset, causes the price to rise (but this does not happen in the short term)
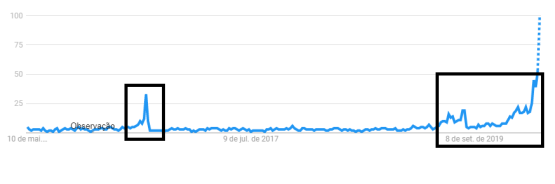
The graph above shows the popularity of searching for the word "halving" on google over the past 5 years. Note that people are more interested in searching for that word now than they were in the past halving and according to the projection of the tool itself this popularity tends to grow exponentially. If this reflects positively on the number of people entering the bitcoin market, there may be a pump like the one we are seeing now.
On the other hand, it also creates a disincentive for small and medium-sized miners as they receive less bitcoins for the same work, causing selling pressure soon after the halving which I believe is already being projected by major bitcoin investors. This, together with the despair that this pressure causes people who came in expecting an immediate appreciation can cause a herd effect, increasing even more this selling pressure.
Translating this to the graphics
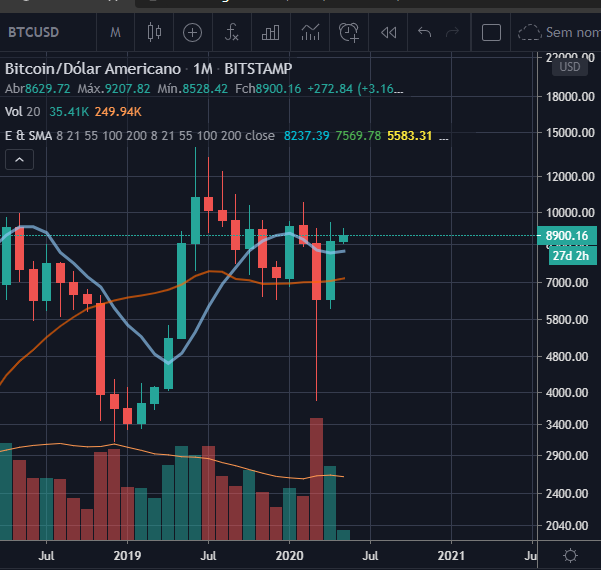
Last week I mentioned that if the monthly candle closed above the 21-period moving average - in the brown graph - it would be an indication that the upward trend would have remained intact and this month's candle for having opened (and if it remains) above the 8-period candle - on the blue chart - further confirms this bullish trend in the long run. It is also possible to see that (if you disregard the shadow of the falling candle) there is the formation of a bullish engulf on a very important support which is the candle of 21 periods in the monthly.
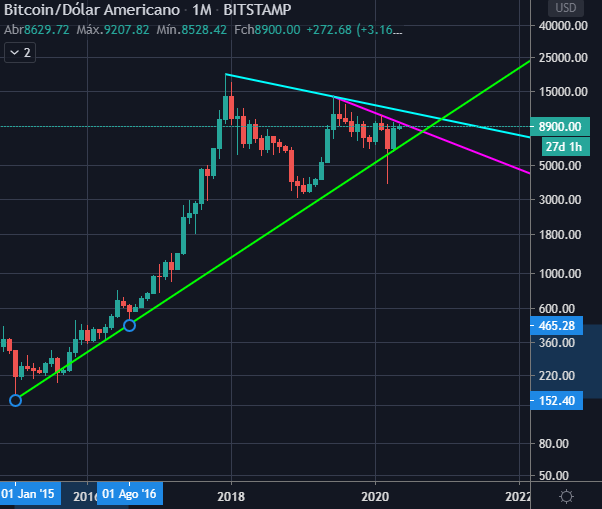
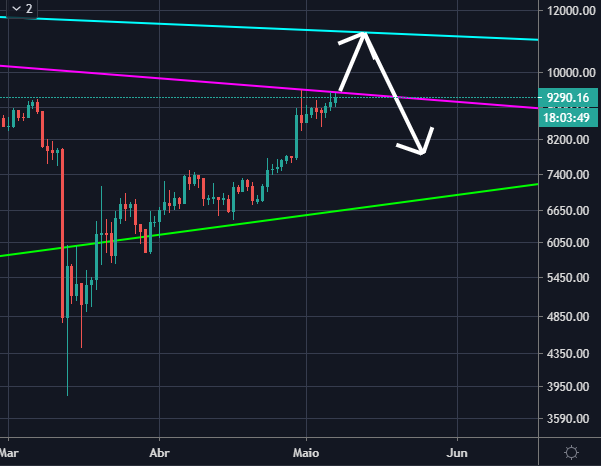
Still in the monthly, it is possible to draw some long-term support and resistance lines that will help us understand the price variation in the short term, as we will see below. The idea here is that the price will break this short-term resistance in pink and go up to the blue one (which is located at approximately $11,000 and return to the conclusion between the green and pink line which is at $ 8,000 (it is also possible to make a shadow that goes back to the $7,000 and returns in the same month)
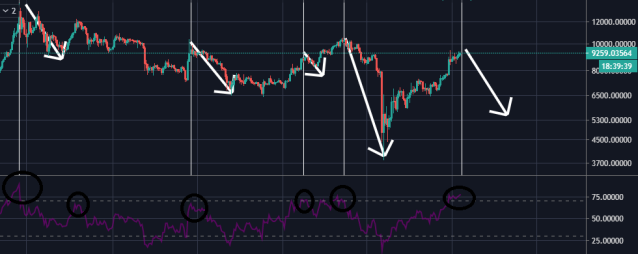
It is possible that whenever the RSI approaches or exceeds 70 on the daily chart there is a drop in price and we are exactly at that point now, the question is when and how much will fall, the point of exhaustion of the maximum RSI seen recently was in 90 (which is the likely point where we will see the RSI for the price to reach $11,000).
If we break the resistance we are testing now the trend is for bitcoin to make a quick move in the daily to test the resistance it has between $ 10 / 11,000. When rejected, we would enter that movement of retraction and liquidation at some point after halving, causing the price to return to values such as 0.5 retraction (which changes depending on the size of the movement that bitcoin makes) or even 0.618.
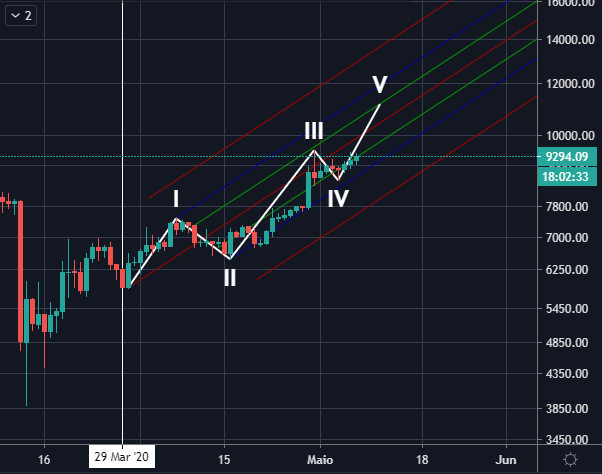
Ignoring the moment before March 29 for technical reasons, the most pertinent count I was able to find for the current movement was this, we are starting wave 5 of appreciation that can reach the median line of the fork or up to 0.5, this creates a confluence with the resistance points mentioned earlier (to be more precise between $10,600 and $11,000). The retraction of this movement completely at the more traditional levels that bitcoin brings us to something close to $7,800.
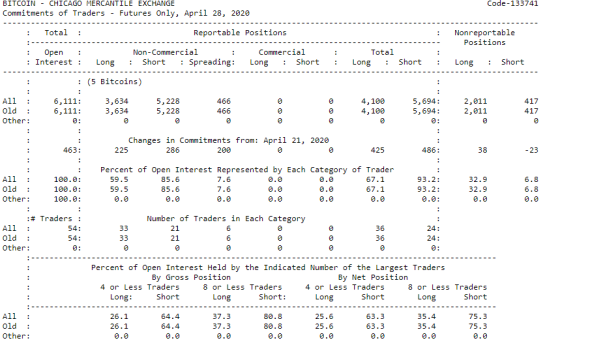
I have been waiting for a few days for the CME report to update but we only have information on the date in the above report, as the price of bitcoin has moved in the last 2 days as I was planning I think it is interesting to release this analysis as soon as possible, here we can see that the predominance of "short" contracts is much greater than "long", showing that whales in the traditional market still remain negative about bitcoin.
When the report updates I bring another analysis saying what we can expect for the end of the month.
Thank you for reading