Good morning
I better start the day with a post, it's been awhile .. The $ES_F count kept me busy for awhile... At the same time the XRP count wasn't very clear for me, I was thinking of a diagonal or a triangle with some more downside, but then it popped a bit on Friday, and that most likely sealed the deal for this zigzag.
Let me start with the big picture today :
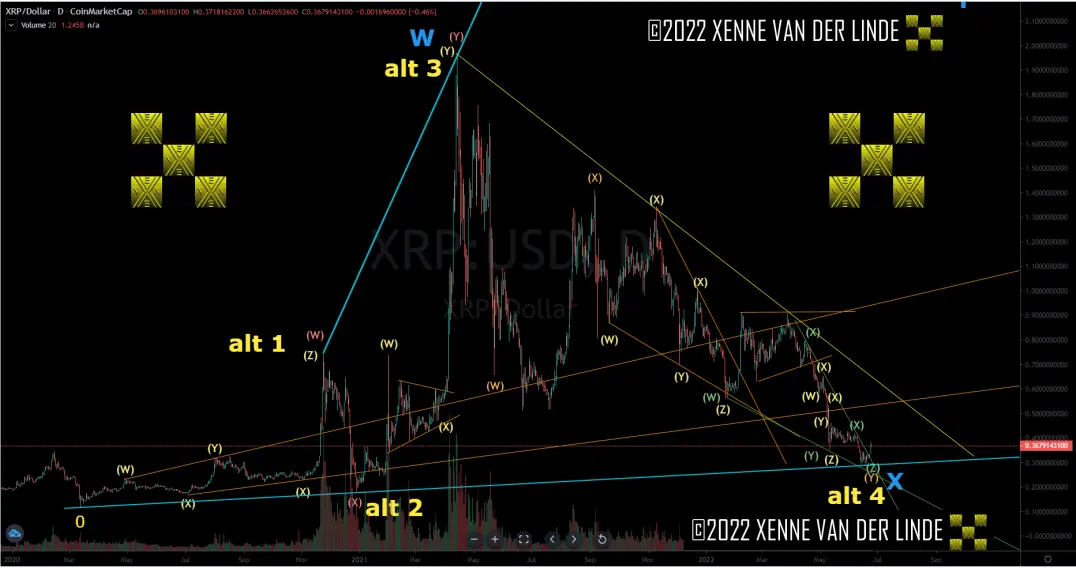
Just a chart, but if you followed me since early 2020 when I started the XRP count, you know how much effort it took to form this chart, it was certainly not clear at the start what pattern would form. A lot of hard work are in that chart & I share my work with you because it keeps me motivated to study the charts on a daily basis. A like or a tip would be appreciated at this point.
What I find funny that in crypto they are using "fractals" all the time, it's something typical for crypto I guess, like price action repeats itself over & over again... Well, not in my experience! A lot has changed since 2017 when it comes to crypto, real adoption comes in sight. AI & crypto are here to stay. Forget what happened in the early days, certainly don't present me with fractals over & over again. But that is what crypto-people seems to like.
Sorry for rambling.
Back to that chart, do we have an important bottom in place? The green triple concluded more then likely and that completes Y on the orange level, The risk I see here is that there will be an X-bounce of orange degree to around the 60 cents regio (the yellow trendline), and that is where we could turn back down. But how much lower can we go? Not much if you ask me. As you can see we bounced from the trendline that connects the "0" with the November 2020-lows, I did state that this was an important level of support, at the same time a breach was allowed, that breach can still come in case we get an orange X here. That said, I will try to count upward from here and see how that goes.
Recent price action :
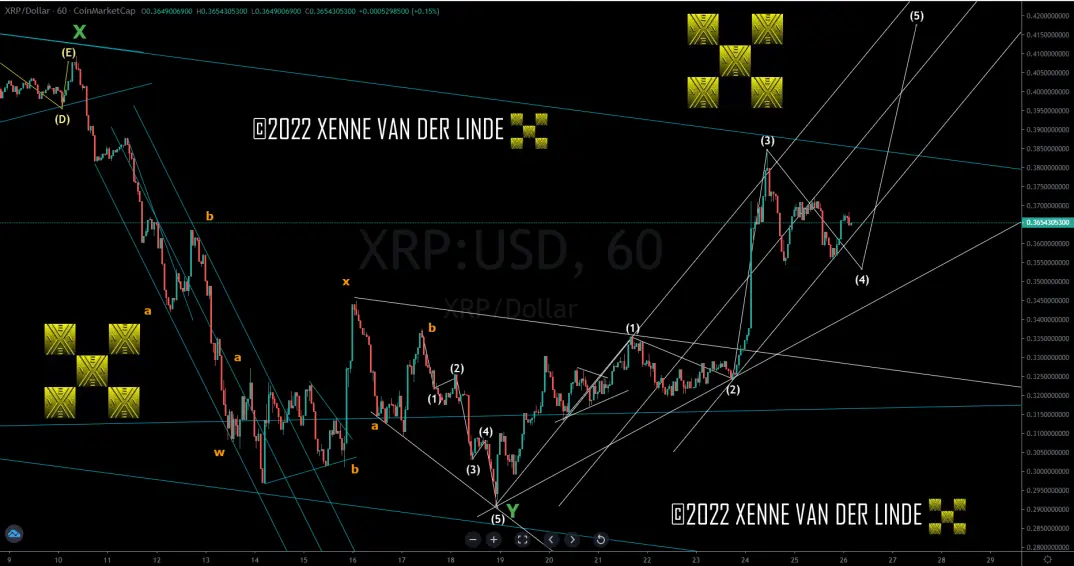
It appears the green Z wave was a double zigzag, somehow I did not see the five waves in that c of y, and that confused me for awhile. From that low we try to count count upward, currently we have 3 waves up, and we would be currently in a 4th wave. The 4th could be complete as a slightly truncated zigzag, it can also form a triangle or maybe the zigzag is still in progress with a triangle in the middle, not possible to say at this point. But a fifth wave is still needed, and in crypto the fifth waves are often powerful, we'll see... A break above that green X at the left would be a nice confirmation that the zigzag indeed concluded, so hopefully we get that. If not there could still be a downside surprise as the impulse from the lows is not looking that "great", another option I see is that the impulse started later after a triangle for Y.
I find it interesting that both XRP & ES_F produced a triangle Y near their local bottom - at the time I said , Y fails to go above W - a sign of weakness, but it may also have been a sign of exhaustion of the trend.
Okay, that's all for now, hopefully we can move up in the coming days & weeks. I do not have the intention to buy or sell XRP anytime soon.
Sincerely yrs,







