This is my 2nd post on this blog. Please check out my 1st post where I am talking about the potential leading diagonal for XRP in the bigger picture, the link to that post is at the bottom.
In such a LD scenario we should make a new low below the may low, a drop to around 60 cents or a bit lower. Such price action could fit in a longer term diagonal and that is a bullish pattern
Since my last post prices has dropped as expected, however I see the danger that prices may not drop low enough, and that the may low may actually hold. Such a scenario would point to a relief rally (crypto markets have been in fear for a quite a long time). But after that relief rally markets would turn back down. If that happens XRP will have a double zigzag from the low without printing a new high and now working on zigzags in the lower direction. How these zigzag structures fits in a bigger picture remains to be seen... worries for later.
Anyways, here is the recent price action and I can see the potential of an ending diagonal concluding the current correction :
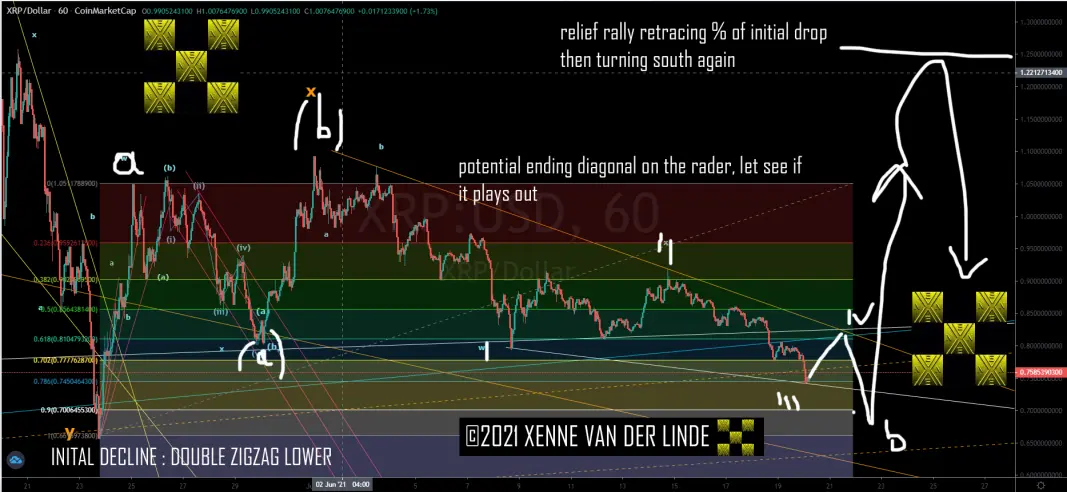
If it plays out like this the correction would most likely be a flat X-wave, that also means we should get at least a 90% retrace on the current c leg, so it may be wise to start buying at these levels... Take also notice that wave v of the diagonal should stay shorter then wave iii. If the ED pattern plays out in the next couple of days you should expect it to be followed by a relief rally, and NOT a rally to a new high, and the retrace should be a 5 wave impulse.
So my advice, keep the ending diagonal on your radar and act accordingly. Please show your support by following / liking/ tipping
Thanks. Xenne







