
Gday fam.
As stated in my previous update, the expanding diagonal has to form before November 4th... Today is November 7th and the price is still below the April high, so this means that the idea of an expanding diagonal is dead & burried!
Or not........
because there is actually the chance that the 4th wave just took longer, in fact it is countable as a "WXY" formation with Y being a triangle. Does it have to be an expanding diagonal? No it can also work as a triple zigzag with that "WXY" being the "XX".
But the important conclusion is that the correction may have completed with that small triangle on November 2nd, and that was exactly 589 days after the start of the bull market for XRP on March 23th of 2020 (after a truncated low) as you can see below :

I originally posted that message on my twitter account on November 3rd. You may or may not know that "589" is an important number in the XRP community, most people refer it to as a price level.... I myself find it very strange that there could be an important turn in the XRP price after 589 days of bull market and a lot of patience (and frustration) for the holders. We'll see what happens from here, but I wanted to point this out. What a great find .... or a great coincidence.
Anyway, back to the count ... so yeah, the big picture can still work as an expanding diagonal IF the 4th wave was a "WXY". If you connect "2" with "4" it will cut off some price action though, is that a problem? I don't know.... A bigger problem for the diagonal count is probably the fact that there is NO overlap anymore between the "1" and where "4" potentially ended. Anyways, it works as good as a triple zigzag... there is visually no difference between a diagonal and a triple zigzag. Also the diagonal can be leading or ending, since it started from a low point it is logical to assume it is leading, in the A or 1 position... So if we are indeed dealing with an expanding leading diagonal it can be bullish longer term, if we are counting a triple zigzag it could collapse 90% at some point, something we have seen with crypto in the past. Why would it be different now? For short term there is not much difference between the 2 ideas, for longer term it is very different, time will have to answer the question.....
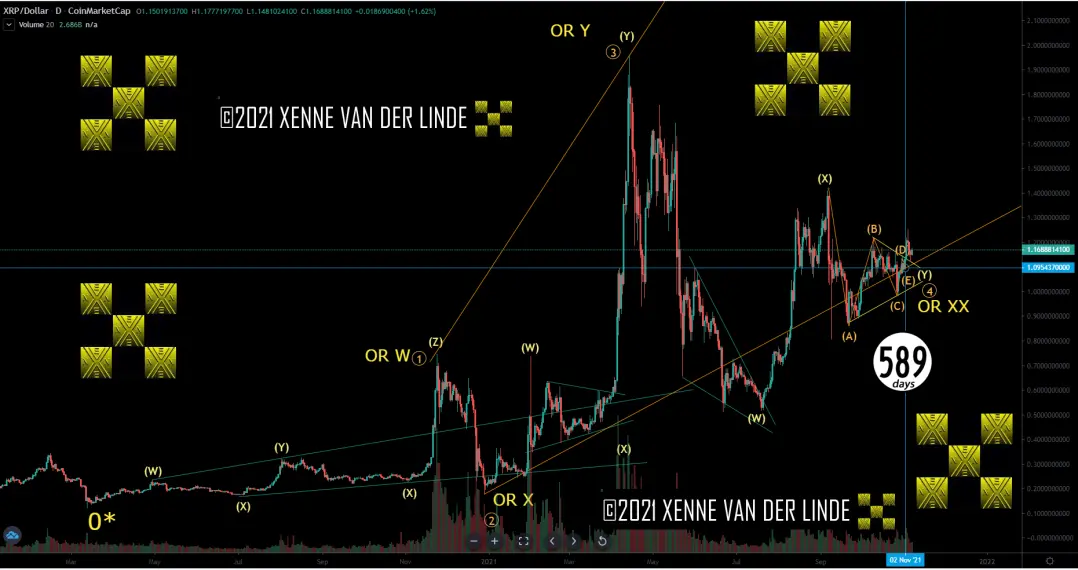
Okay , but why is the price still this low? It is true that the Y-triangle did not bring the expected explosion of price, that said and upward count is possible (see below)? If the 4th wave finished indeed last Thursday the teller has been reset... and in a diagonal the potential wave 5 has to stay shorter in time then wave 3, so this means less then 141 days, if you add 141 days to November 2, that gives March 23rd. So we are indeed dealing with an expanding diagonal it should have concluded before that day. If we are dealing with a triple zigzag there is no time limit really, it can go on as long as it wants. But what I wanted to say it means we have time to build a healthy structure from here, we are not in a hurry anymore. I will try to count upward from here, and the decision to sell will be up to you.
Let me finish this post with a look at the reset price action... Since the conclusion of the Y triangle that ended with a small triangle itself we have seen some upside, but in a very choppy way... it can work as leading diagonal though. After that we back-tested the triangle, and now we go up a bit but not in spectacular way. If we are indeed in a third wave the buying should pick up and we should start printing higher highs... it is important to monitor this... If we see more downside then it is time for a more bearish count, for instance a bigger triangle for "Y", but I want to give the bulls the benefit here until we see a failure to play.
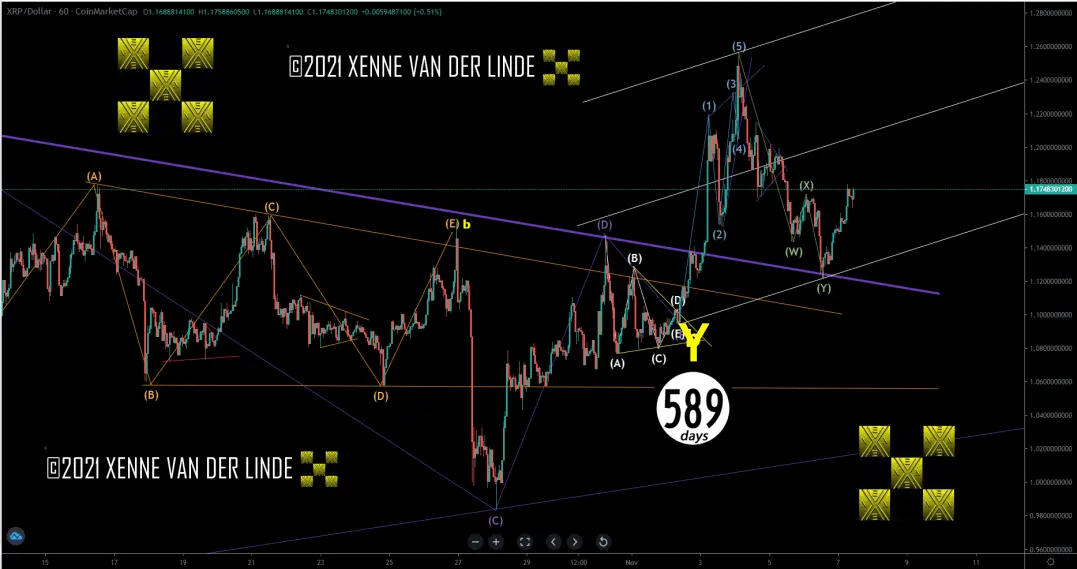
That is all for now, hope you enjoy the show, hopefully the sequel will be better then the original.
Take care,







