
Quick Summary
The crypto market is facing its sharpest reality check of 2026. After teasing an aggressive run toward the $80,000 mark earlier this month, Bitcoin ($BTC$) has been sharply rejected from its $77,000 overhead resistance, crashing through key psychological defenses to trade near $72,800.
This isn't a simple technical exhaustion or a random "whale" dump. We are witnessing a brutal convergence of three macro forces: sticky U.S. PCE inflation data, a sudden escalation in U.S.-Iran geopolitical tensions near the Strait of Hormuz, and a massive $1.7+ billion institutional exodus from Spot Bitcoin ETFs.
If you are wondering whether this is a "buy the dip" opportunity or the start of a deeper correction toward $60,000, this data-driven breakdown covers exactly what is driving the capital flight and the critical levels to watch next.
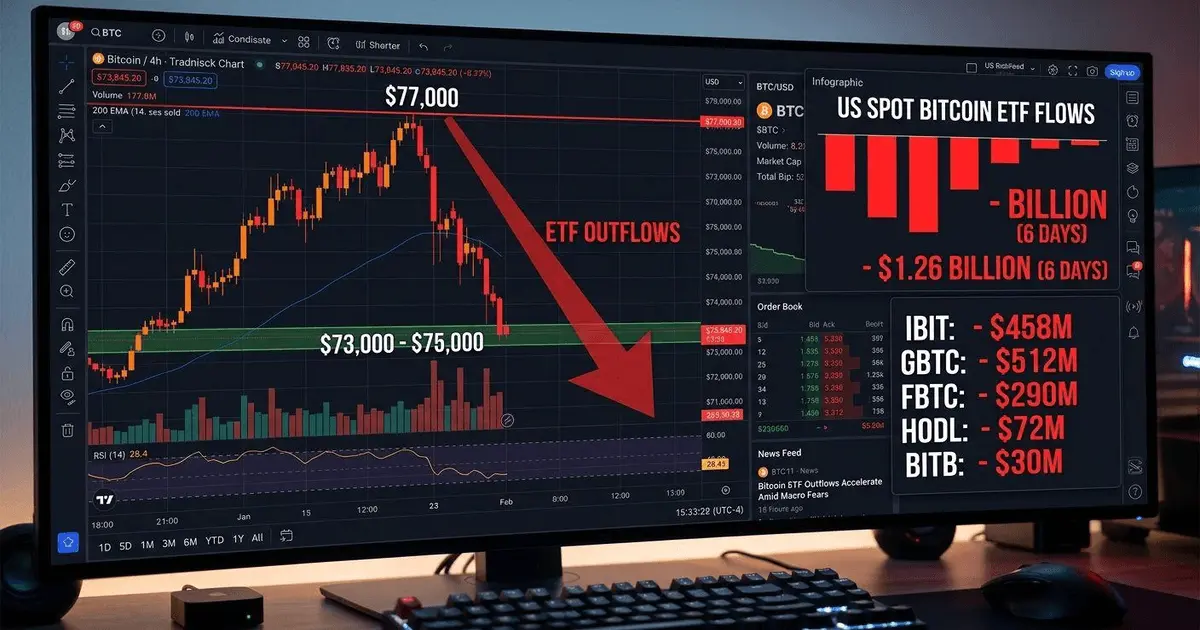
Technical chart showing BTC's rejection at $77,000 alongside over $1.26 billion in consecutive institutional ETF liquidations.
1. The Death of Easing: Sticky PCE Inflation & The Fed’s Hidden Pivot
For months, the crypto market rallied on the assumption that global central banks would aggressively cut interest rates in the second half of 2026. That illusion was shattered this week.
The latest Core Personal Consumption Expenditures (PCE) reading the Federal Reserve's absolute favorite inflation metric came in hot, hovering close to 3.8%. Combined with rising energy costs driven by global supply chain disruptions, major banking institutions like Goldman Sachs have revised their timelines, predicting that core inflation will remain sticky around 3% for the rest of the year.
Why this hurts Crypto:
-
The "Higher for Longer" Regime: With the labor market remaining stable, the Fed has officially dropped its easing bias. Incoming Fed Chair Kevin Warsh is facing an uncomfortable environment where rate hikes are no longer entirely off the table if inflation refuses to cool down.
-
The Liquidity Squeeze: Bitcoin thrives on excess global liquidity. When interest rates stay elevated and the U.S. Dollar Index ($DXY$) holds near multi-month highs, capital flows out of highly volatile "risk-on" assets (like crypto and tech stocks) and retreats into safe-haven U.S. Treasuries.
2. Geopolitics Ignite: The Strait of Hormuz Catalyst
Crypto is often touted as digital gold a geopolitical hedge. However, during acute, sudden military escalations, the immediate market reaction is almost always a panic dash for cash (U.S. Dollars).
The immediate trigger for the mid-week dump below $75,000 was a fresh round of military engagements involving an Iranian site near the strategically critical Strait of Hormuz.
(Geopolitical Escalation) --> (Oil Prices Surge) --> (Inflation Fears Renewed) --> (Algorithms & Whales Liquidate Risk Assets)
As oil prices reacted to the uncertainty, algorithmic trading desks immediately adjusted their risk parameters. This macroeconomic anxiety cascaded straight into the crypto derivatives markets, triggering a massive liquidation event. Over the last 24 hours alone, more than 160,000 traders were wiped out, resulting in a staggering $900 million in total crypto liquidations with long positions accounting for over 93% of the pain.
3. The ETF Doom Loop: Institutional Capital Flees IBIT and GBTC
Perhaps the most alarming metric for structural bulls is the sudden reversal in institutional behavior.The very vehicles that drove Bitcoin to its historic highs earlier this year U.S. Spot ETFs are now acting as an accelerant for the downward move.
Data from financial trackers shows that over the past seven trading sessions, Spot Bitcoin ETFs bled more than $1.7 billion in net outflows.
ETF Fund Single-Day Net Flow Impact (May 27/28) Cumulative Context BlackRock (IBIT) -$527.8 Million (2nd Largest Daily Outflow Ever) Still up over $2B YTD; holding $64B in lifetime inflows. Grayscale (GBTC) -$104.7 Million Continued structural attrition. Fidelity (FBTC) -$60.3 Million Moderate risk reduction by retail/wealth platforms. Morgan Stanley (MSBT) +$4.3 Million The lone green shoot in a sea of red.
How the "Doom Loop" Works:
When institutional investors log into their brokerage accounts and redeem their ETF shares during a macro panic, the fund managers (like BlackRock and Fidelity) cannot simply hold the asset. By law, they must sell the underlying physical Bitcoin on the spot market to settle those cash redemptions.
This institutional selling puts direct downward pressure on the spot price, which lowers the net asset value (NAV) of the ETF, causing more panic and triggering the next wave of redemptions.
4. Technical Outlook: The Critical Levels to Watch
From a structural standpoint, the total crypto market capitalization has slid below the crucial $2.5 trillion mark. Bitcoin's short-term trend model has flipped bearish, and the market is caught in a tight liquidity pocket.
(Upside Liquidity / Resistance) --> $79,000 - $80,000
(Current Trading Range) --> $72,800 - $73,400
(Immediate Support Zone) --> $71,000 - $73,000
(Macro Defensive Line) --> $70,000 (Psychological Floor)
-
The Bull Case (Relief Rally): For the bulls to reclaim control, Bitcoin must cleanly defend the $71,000-$73,000 liquidity cluster. If a diplomatic resolution or ceasefire progress occurs between the U.S. and Iran, a short squeeze could quickly push prices back toward the $76,000 resistance, opening a path back to $79,000.
-
The Bear Case (Deep Correction): If institutional ETF outflows continue into next week and the negative Coinbase Premium persists (indicating weak U.S. demand), a clean break below $71,000 will expose the ultimate psychological line of defense at $70,000. Losing that level would shift the macro target down to the $60,000 range, signaling a prolonged summer consolidation.
The Bottom Line: Don't fight the macro trend. Until the regional tensions ease or the core PCE data shows a definitive downward path toward the Fed's 2% target, expect volatile, choppy price action. Keep your leverage low, protect your capital, and watch the daily ETF flow data like a hawk.
Verified Research & Data Sources:
-
ETF Capital Flows: SoSoValue & CoinGlass Institutional Metrics (Updated May 28, 2026).
-
Macroeconomic Forecasts & Inflation Data: Goldman Sachs Global Investment Research & IMF Core PCE Outlook Report.
-
Market Intelligence & Liquidations: Binance Square OTC Weekly Insights & TradingKey Crypto Derivatives Analytics.
⚡ Never miss an urgent market shift: I post daily real-time crypto setups, micro-analyses, and exclusive charts. Follow My Daily Updates Here
🎮 Want to turn your gaming time into passive income?






