
ETH futures netflow just printed its heaviest outflows in seven weeks, and price still refuses to lose $2,400. I’ve seen this setup plenty of times, and it usually ends one of two ways.
Spot is sitting around $2,505 on the 4H, right in the middle of the range. That’s the worst seat in the house, so I’m not forcing anything from here.
What the Flow Is Telling Me
The red bars are loud. Around 5 Oct and 8 Oct, futures netflow dumped roughly $1.5B to $1.57B in a single 4H candle each. Earlier, near 23 Sep, there was another print around -$1.2B.
The green side isn’t shy either. We saw about $1.37B on 3 Sep, $1.35B on 12 Sep, and a $1.17B bar on 10 Oct. The 18 to 21 Sep inflow cluster lined up with ETH breaking out of the $2,550 range and running to roughly $2,800.
Netflow shows where capital moved, not who’s right. Treat it as context, not a signal.
The Pattern I Care About
Oversized prints at range edges are usually forced flow, not conviction. The early-Sep and mid-Sep inflow spikes landed near the $2,355 lows. The 8 Oct outflow landed on the flush into $2,410.
I’m not calling that capitulation yet. Real capitulation needs a follow-through reclaim, and ETH has only bounced to around $2,580. Notice also that the -$1.1B bar on 12 Oct came after the bounce. Sellers are still showing up into strength.
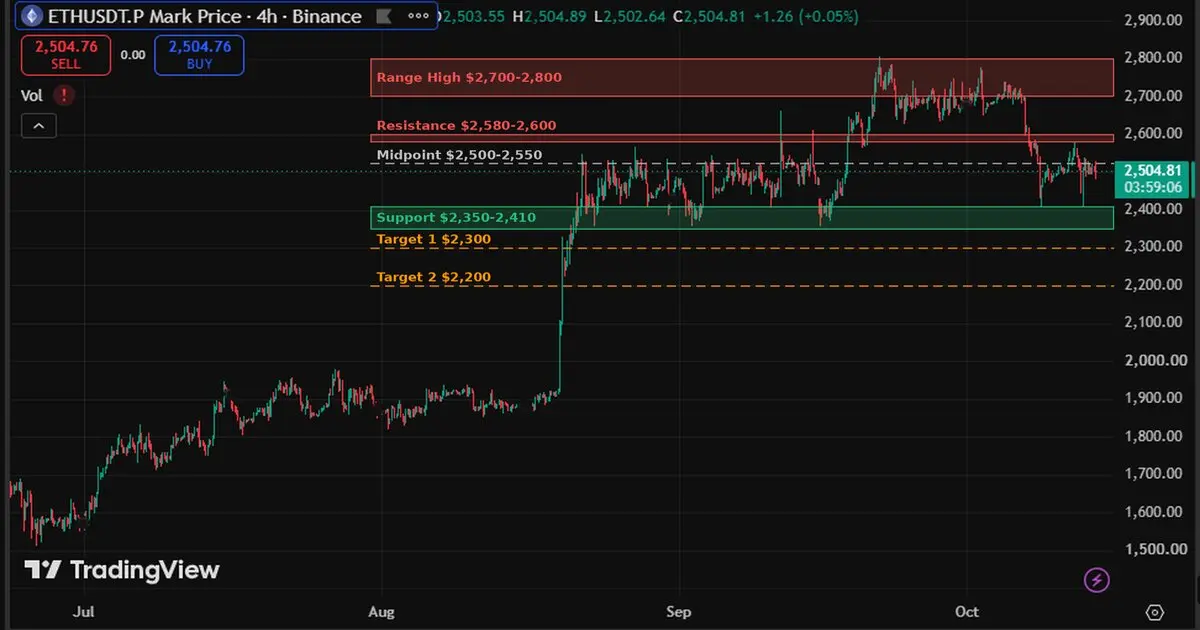
ETH key levels on the 4H chart. Source: TradingView
Levels I’m Watching
- Major support: $2,350 to $2,410. It’s been tested early Sep, mid-Sep, and twice in October.
- Range midpoint: $2,500 to $2,550. Expect chop here.
- First resistance: $2,580 to $2,600.
- Range high: $2,700 to $2,800.
- Downside targets: $2,300, then $2,200.
The $2,200 target isn’t random. In mid-Aug ETH ripped from about $1,900 to $2,550 almost in one move, so there’s very little traded volume between $2,000 and $2,350. If support gives way, there’s an air pocket underneath.
Bullish Case
Dip buyers have defended this zone repeatedly, and that $1.17B inflow on 10 Oct says someone is still bidding.
I want a 4H close above $2,600, with green netflow bars stacking up instead of one lonely spike. First target is $2,700, then $2,800. The idea is dead on a 4H close below $2,350.
A long from $2,600 with a stop at $2,540 and a target at $2,700 is only about 1.7R. In the middle of a range, that’s mediocre. Tighten the stop or skip it.
Bearish Case
A support zone tested this many times rarely survives the next test. Add outflows printing on bounces, and the bears have a fair argument.
I’d want a 4H close below $2,350, ideally with a red netflow spike behind it. Targets are $2,300 and then $2,200. Expect a liquidity sweep wick under $2,350 first, because that’s where the stops sit.
I’d rather short the failed retest from below than chase the breakdown candle. Chasing is how you end up buying the sweep. The bear idea is invalidated by a 4H close back above $2,410 after the break.
What This Chart Can’t Tell You
This is a netflow chart only. It has no open interest, funding rates, or liquidation data, so I’m not going to pretend I can read leverage flushes off it.
Before sizing up, check funding and OI on the same 4H timeframe. If funding stays flat while price coils, a squeeze in either direction gets more likely.
Research References
- Coinglass, ETH Futures Inflow/Outflow (4H netflow vs price, 25 Aug to 14 Oct)
- TradingView, ETHUSDT.P Mark Price on Binance (4H, used to cross-check support, resistance, and range highs and lows)
- Netflow values and price levels are read from the charts and are approximate.
Trading Bias
I stay neutral between $2,410 and $2,600, because there’s no edge in the middle. Longs need a 4H close above $2,600. Shorts need a 4H close below $2,350. Watch the next big netflow bar near $2,400, because that print decides whether this support holds.
Want the original write up with the charts? Read the full breakdown on TechnoLoger Insights.
Disclaimer: This post is for educational and research purposes only and does not constitute financial advice. Always do your own research (DYOR).






