Today, when the halving in the BTC network is successfully completed, many market participants are preparing to continue the upward trend of BTC.
However, the volume profile of the last rally provides an unexpected negative signal, according to which the bearish period in the Bitcoin market may stretch for many more months.

Analysis of the volume profile of the last BTC rally
“Volume precedes price” is a popular phrase in traditional markets that may not be used as often by crypto traders.
The message underlying this idiom is that “smart money” often occupies a market position in advance, and this does not always reflect on price dynamics immediately. But trading volume can give a warning signal that something large-scale is happening behind the scenes.
Volume is also an important factor in analyzing the validity and strength of a trend. Often, certain volume profiles correspond to specific graphic patterns.
Another generally accepted fact is that trading volume can signal false breakouts. If a pattern or trend is canceled against a background of weak volumes, then this movement can be a trap, and soon the price will go in the opposite direction.
As one of the crypto analysts Junior Lancaster noted, the volume profile weakened during the last BTC rally from $ 3,800 above $ 10,000:
The long-term bearish period in the crypto industry may recur
So, according to technical analysis, a decrease in volume with rising prices is a bearish signal.
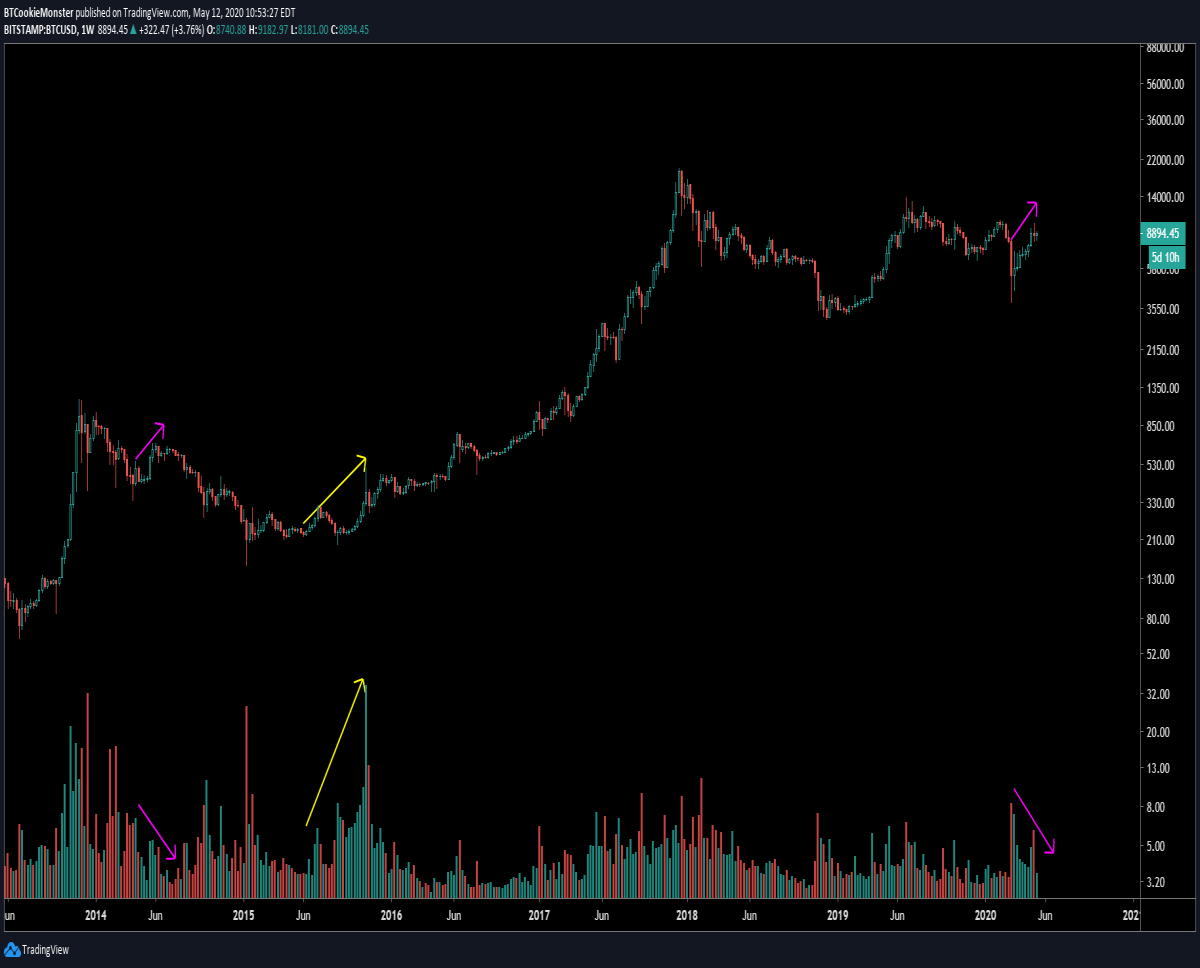
More importantly in this case, the current dynamics of volumes on the weekly chart resembles the situation on the market just before the beginning of a long-term bear period from mid-2014. Pay attention to the left side of the graph provided by Junior Lancaster:
- A similar surge was noted in 2014 (purple arrows) long before the final correction bottom was reached.
- Only after supporting purchase volumes did the BTC trend change its character (yellow arrows) and a bullish period began.
Thus, an analysis of the volume profile confirms that Bitcoin can still be vulnerable to another correction. Also, the beginning of a new long-term bear market cannot be ruled out.
Moreover, if miners surrender, it can increase pressure on the asset and reduce the chances of any recovery in the near future.
After the collapse in 2014, when the volume profile provided the same bearish signal, it took the leading cryptocurrency almost three more years to reach its previous historic high.
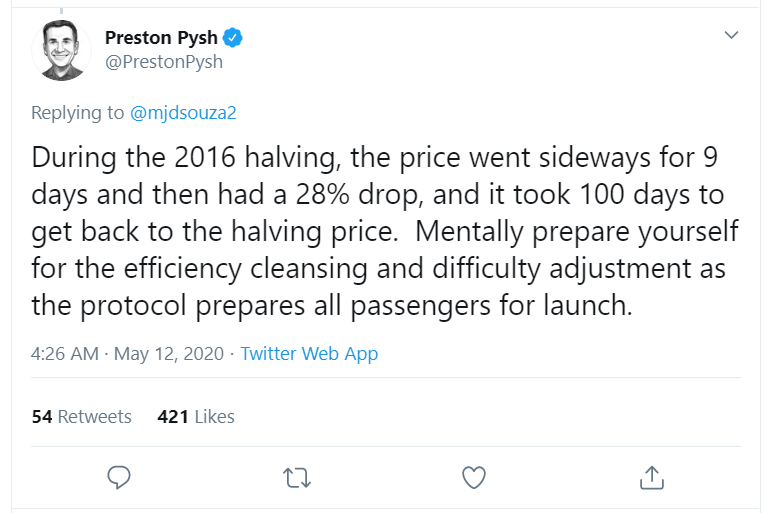
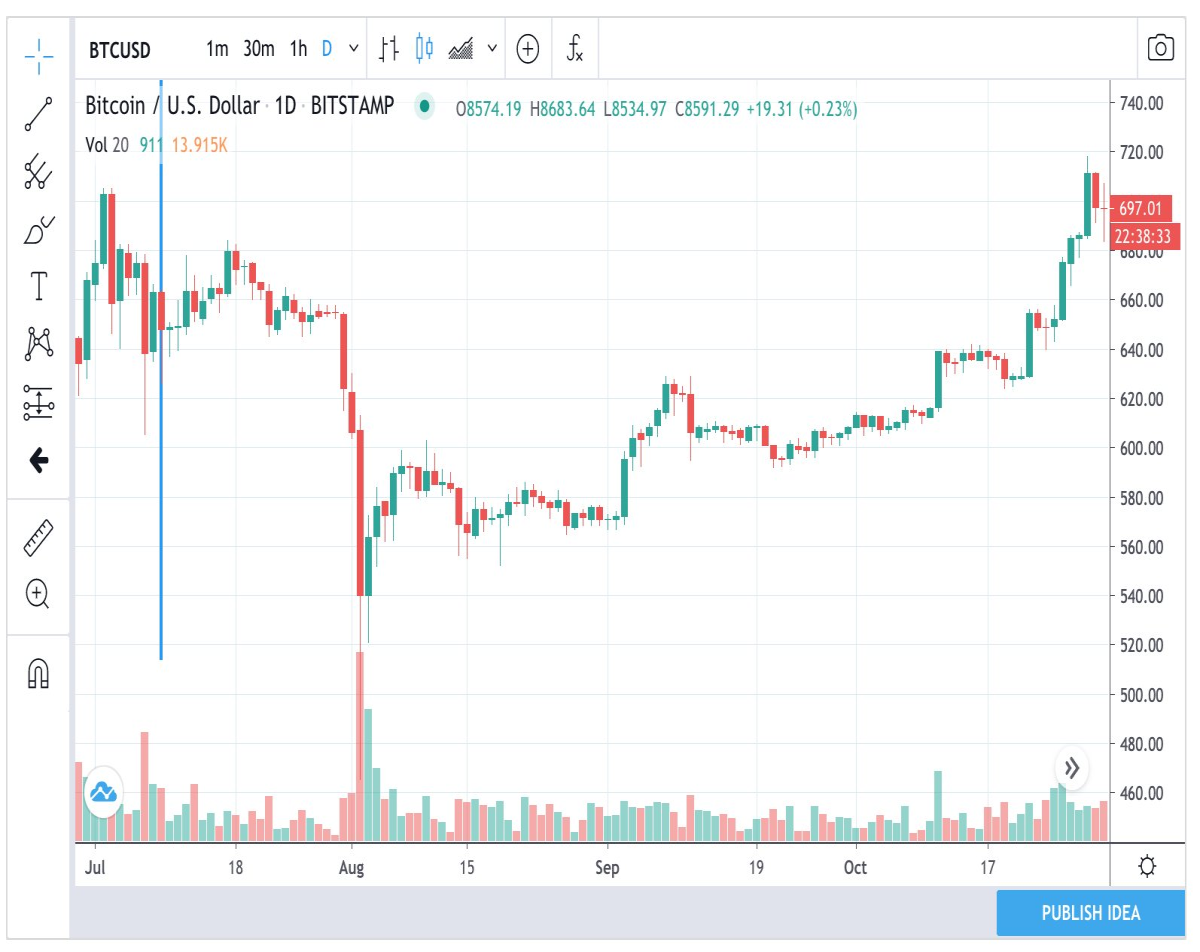
Moreover, after halving in 2016, restoration to the previous level took 100 days: