As a famous trader put it, once a year Ripple “shoots” at least 50%, and at the moment, technical charts signal a possible breakthrough. Moreover, the XRP rally can occur regardless of BTC.
Is Ripple's asset finally ready to recoup its investment?

Crypto analyst: XRP ready for annual rally paired with BTC
XRP is still among the top three cryptocurrencies by market capitalization, along with Bitcoin and Ether. However, at the same time, the Ripple token is one of the most unprofitable assets of the current 2-year bear period.
The XRP peaked at the end of 2017, exceeding $ 3.50, and then fell more than 95% to lows of about 10 cents last month. Sales pressure is intensifying amid the ongoing proliferation of coronavirus, which has become a catalyst for mass sales in traditional markets.
According to one crypto analyst, after such an incredible 2-year crash, XRP finally shows signs of strength on the weekly timeframe, and there are hopes for a significant rally.
So, a Pentoshi trader said yesterday that “A holiday happens on every street”, and “XRP can fire by starting one of those annual ralli that make him famous”:
Sustainable ralli rarely seen in Ripple market.The company itself, which is accused of over-selling its own savings, also contributes to this instability. Moreover, investors who get the opportunity to approach the breakeven point after a 2-year freeze of assets in the asset immediately sell tokens at any jump in the exchange rate, increasing pressure on the asset.
However, at least once a year, usually during the Swell conference period, pumps occur in the XRP market.
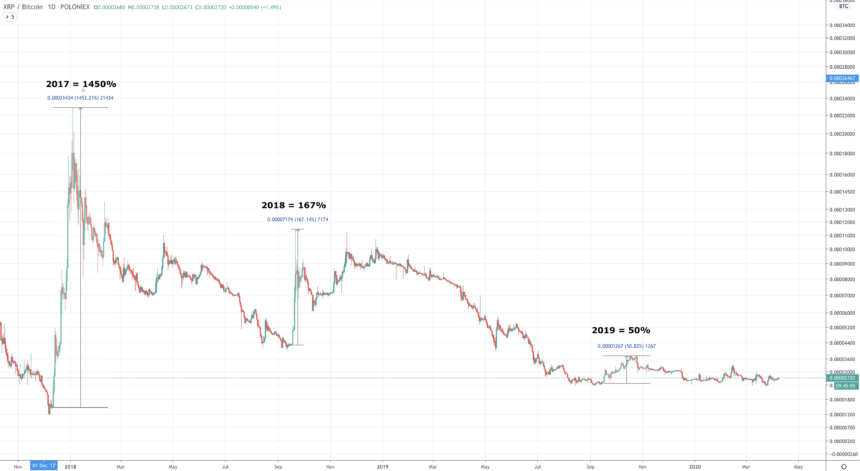
Starting in 2017, a pump happens on the XRP market once a year
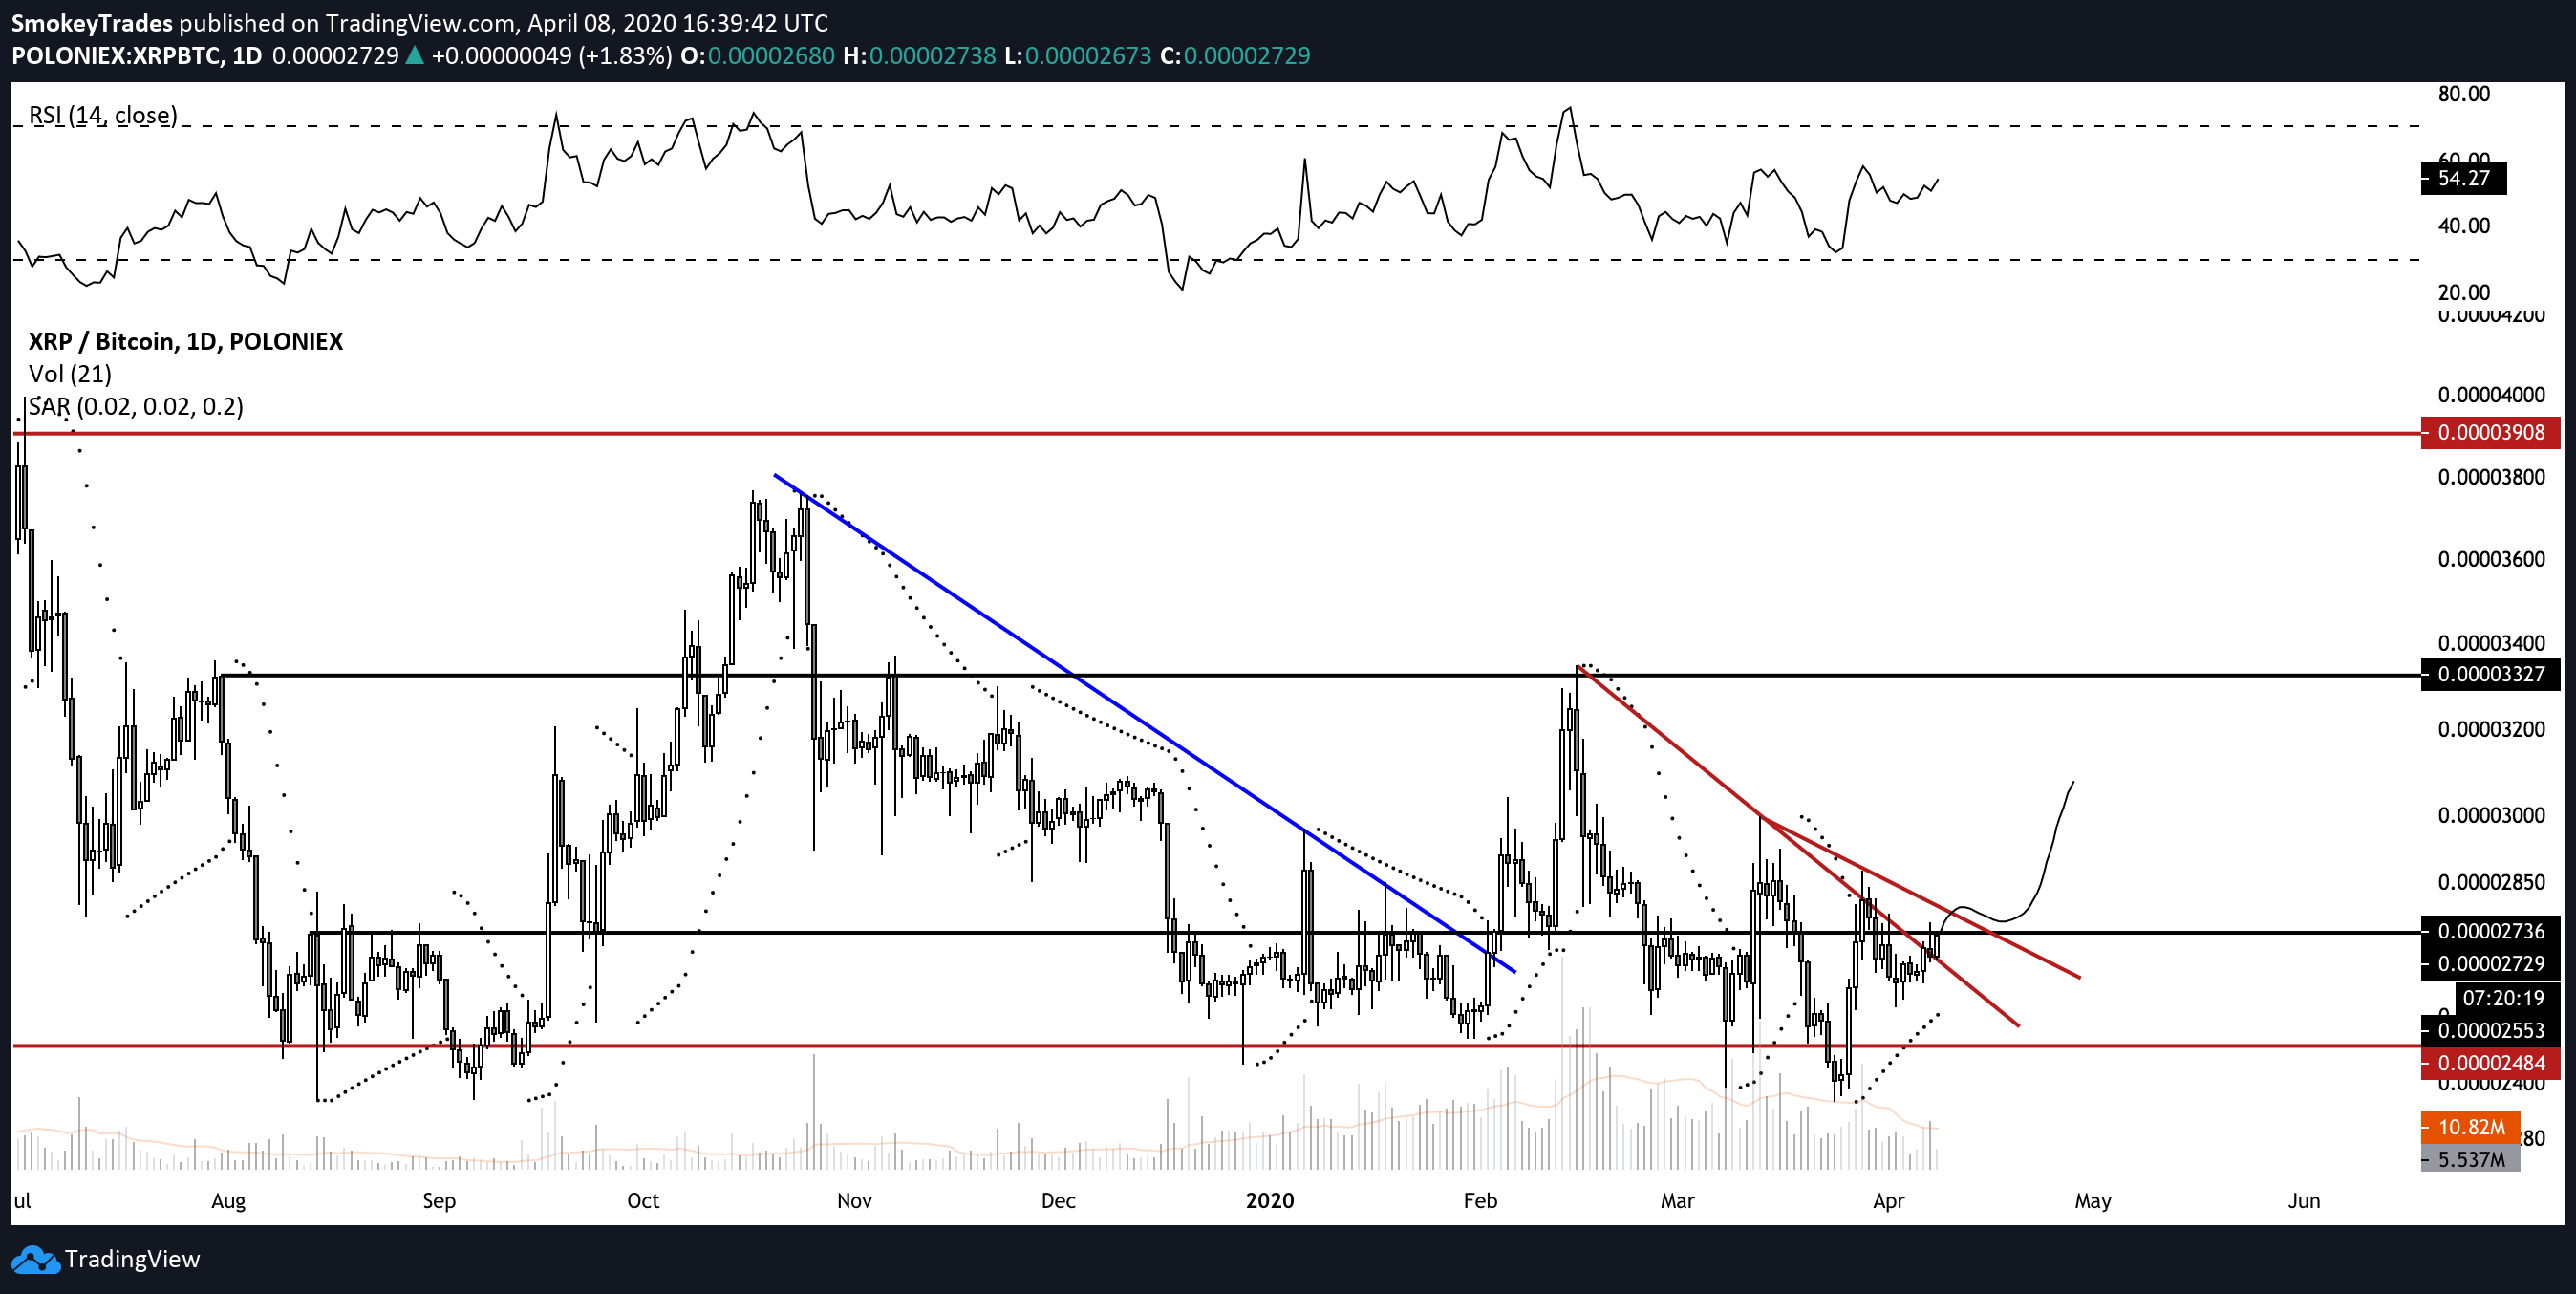
Trader TraderSmokey also closely monitors the Ripple asset, waiting for a breakthrough of the current resistance levels to enter the long. Currently, XRP is trading at around 0.00002730 Satoshi, and the target level of short-term growth, according to the analyst, is near the February highs:
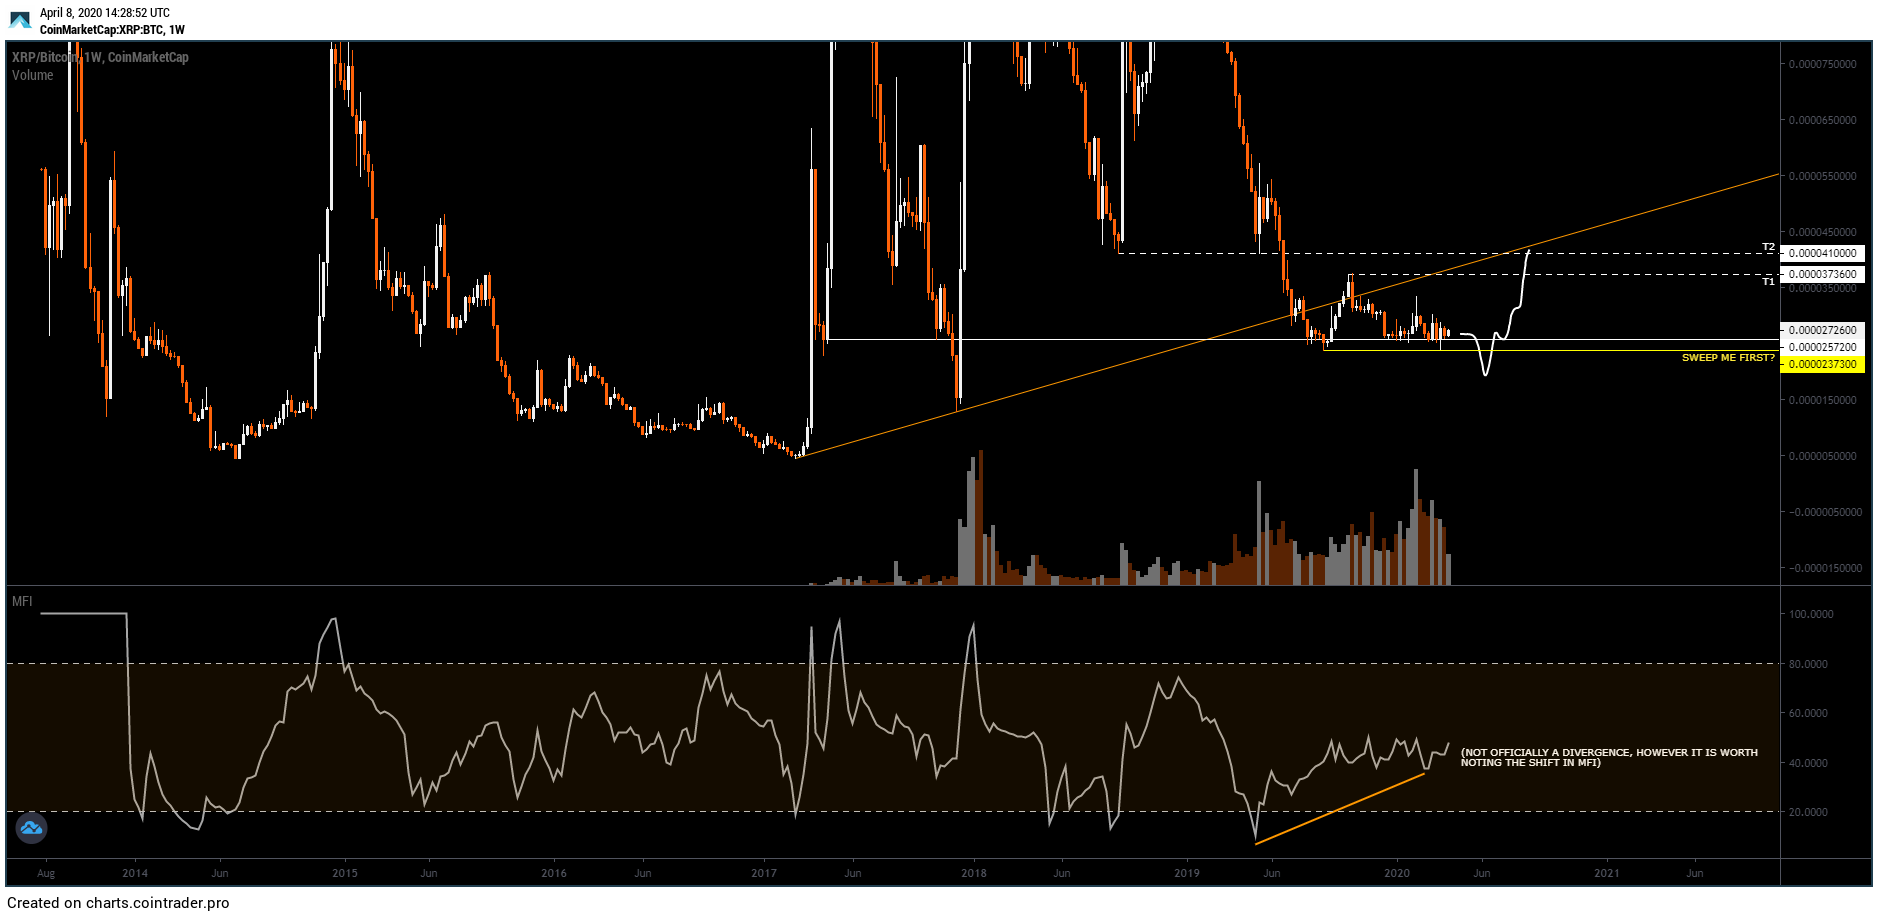
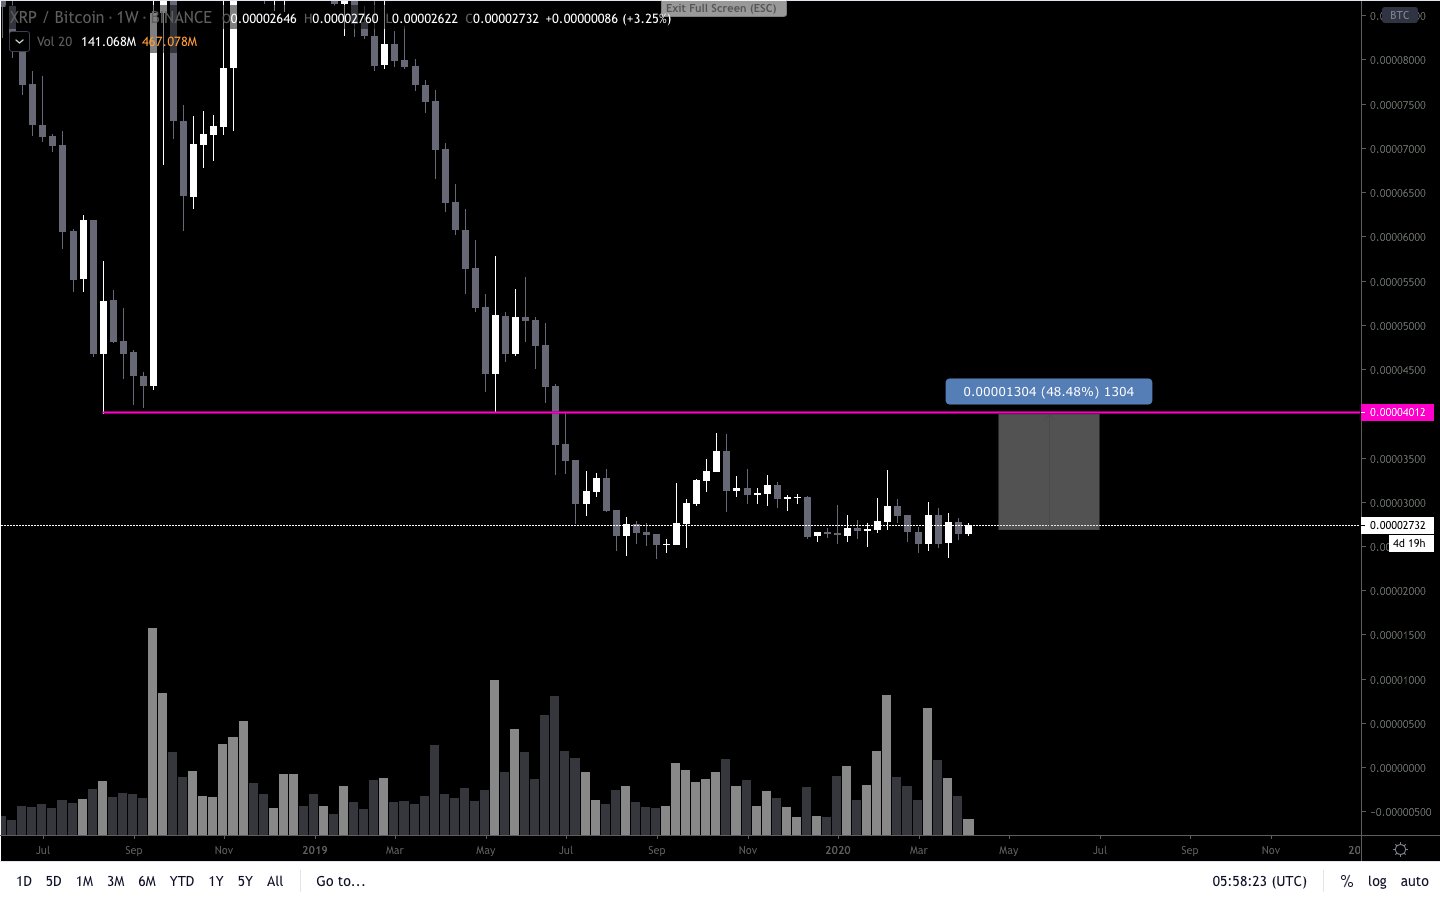
Crypto trader Bagsy published an even more optimistic forecast, noting that "quite real something like that." The target marks of the next breakthrough on the analyst’s chart are located near the diagonal resistance approximately 50% above the current levels: