
Digibyte (DGB) has broken through the long-term downtrend resistance line, which may indicate the beginning of a new bullish trend.

At the same time, quotes are located near an important resistance zone, which means that in the near future, a decrease in the token is possible.
Long term breakout
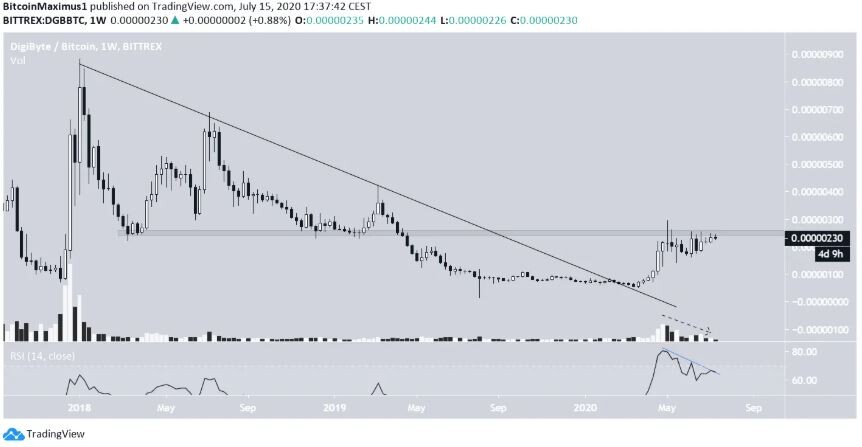
In early April, the DGB broke through the long-term downtrend resistance line from 2018. The altcoin then accelerated its rise and peaked at 294 satoshi on May 6.
However, the coin could not hold on to the reached heights and rolled back under the 250 satoshi mark, where it has since settled. The token recently confirmed the status of this level as resistance, which acted as support for most of 2018 and 2019, which gives it significance.
A breakout of this zone can trigger an acceleration in the ascent. However, declining trading volumes and bearish divergence signals from the RSI indicate that in the short term, the price will pull back and decline.
Symmetrical triangle
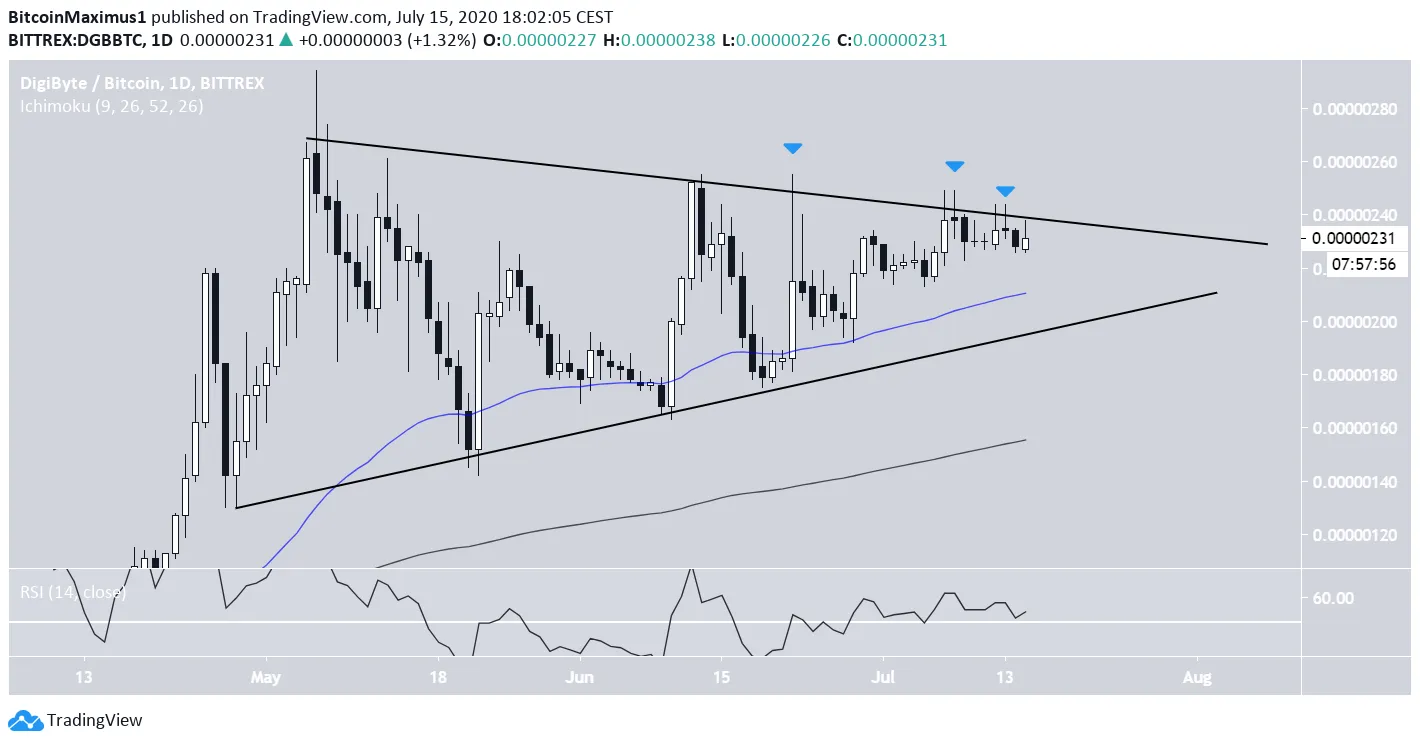
The daily chart shows that the price has been inside the symmetrical triangle since reaching the aforementioned high on May 6. At the time of this writing, quotes are directly below the resistance line of this pattern, forming several long upper wicks, which indicates the presence of downward pressure.
At the same time, the 50- and 200-day moving averages have formed a bullish crossover and act as support. This indicates the formation of an uptrend. Moreover, the RSI is not signaling a bearish divergence and is above the 50 level. In other words, the technical indicators on the daily charts indicate a favorable outlook.
Despite the fact that the symmetrical triangle is traditionally considered a neutral pattern, it was formed after a rally, which means that an upward breakout is likely.
Elliot waves
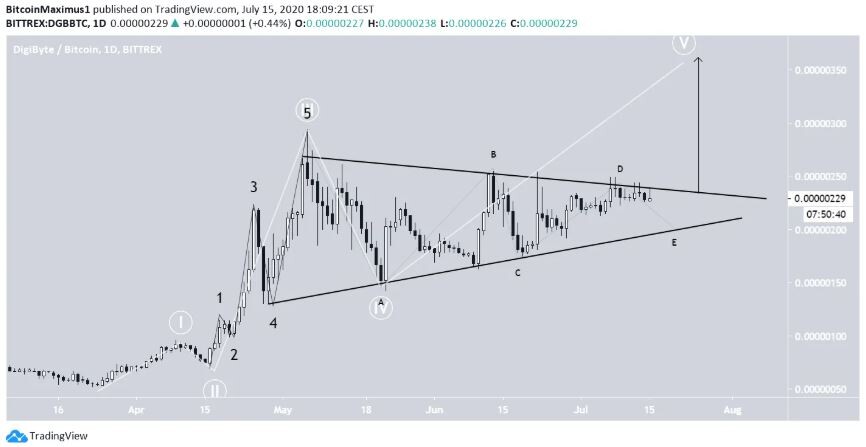
On March 17, the altcoin began to form a five-wave Elliott pattern. After the third wave, the fourth is formed in the form of A-B-C-D-E. The fourth waves are often realized within triangles, which is observed even now. A bullish breakout for the entire pattern can send quotes to the 365 satoshi area, where the fifth wave will end.
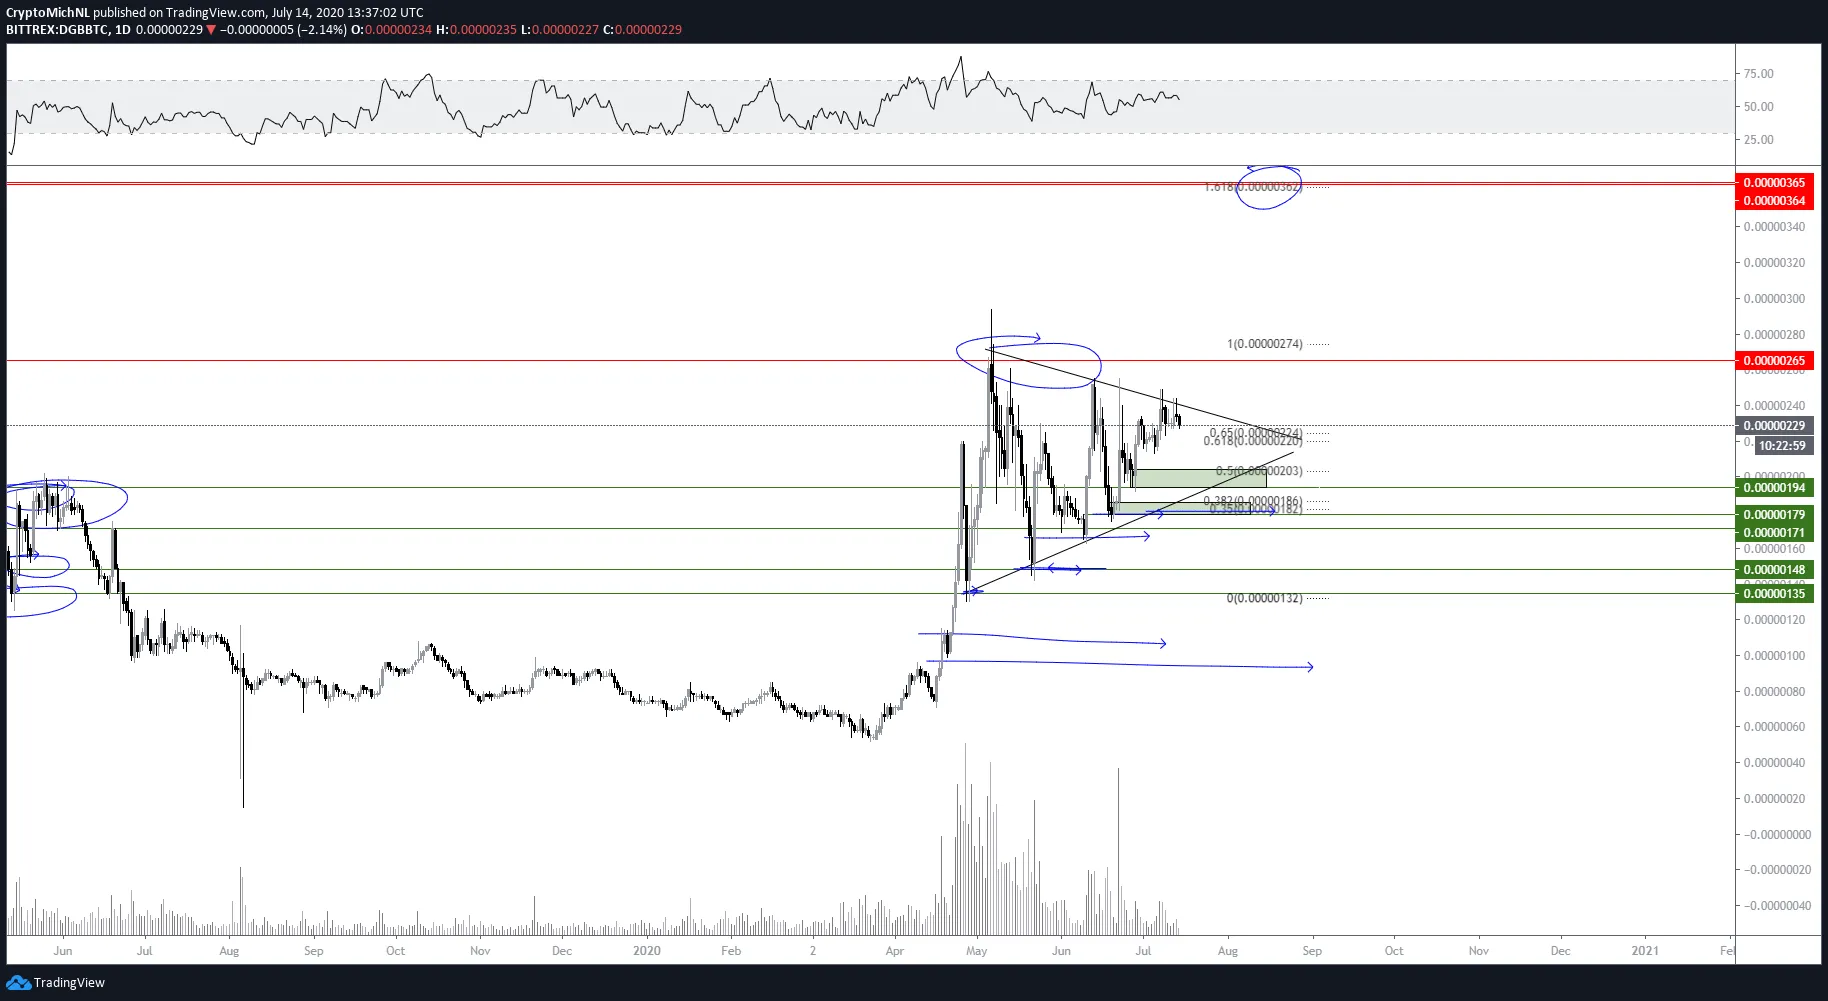
Cryptocurrency trader @CryptoMichNL notes that DGB is trading in a symmetrical triangle and is forecasting a bullish breakout with a 365 Satoshi target. Altcoin will be able to achieve this goal if the price rises for the entire length of the pattern.
So, the DGB is in a symmetrical triangle and could make a bullish breakout. However, bearish divergence signals on longer-term charts raise doubts about the prospects for such a scenario.


