On May 28, the Cardano (ADA) rate made a bullish breakdown of an important resistance area and at the moment showed a 25% increase within the day. However, the price began to show signs of short-term weakening.
Cryptocurrencies continue to flex their muscles. Just yesterday, we talked about the THETA race to historic highs. A similar local focus of activity was also noted in the case of Cardano (ADA), a cryptocurrency that is now in 11th place in terms of market capitalization.
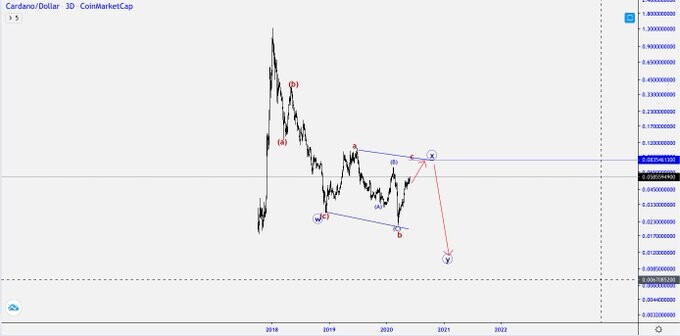
However, despite yesterday's bullish breakthrough, it remains unclear whether this positive attitude is long-term. Cryptocurrency trader The EW Guy (@TheEWGuy) suggested that the ADA would make another attempt at growth, but then plummet.
Long-Term Upward Support Line
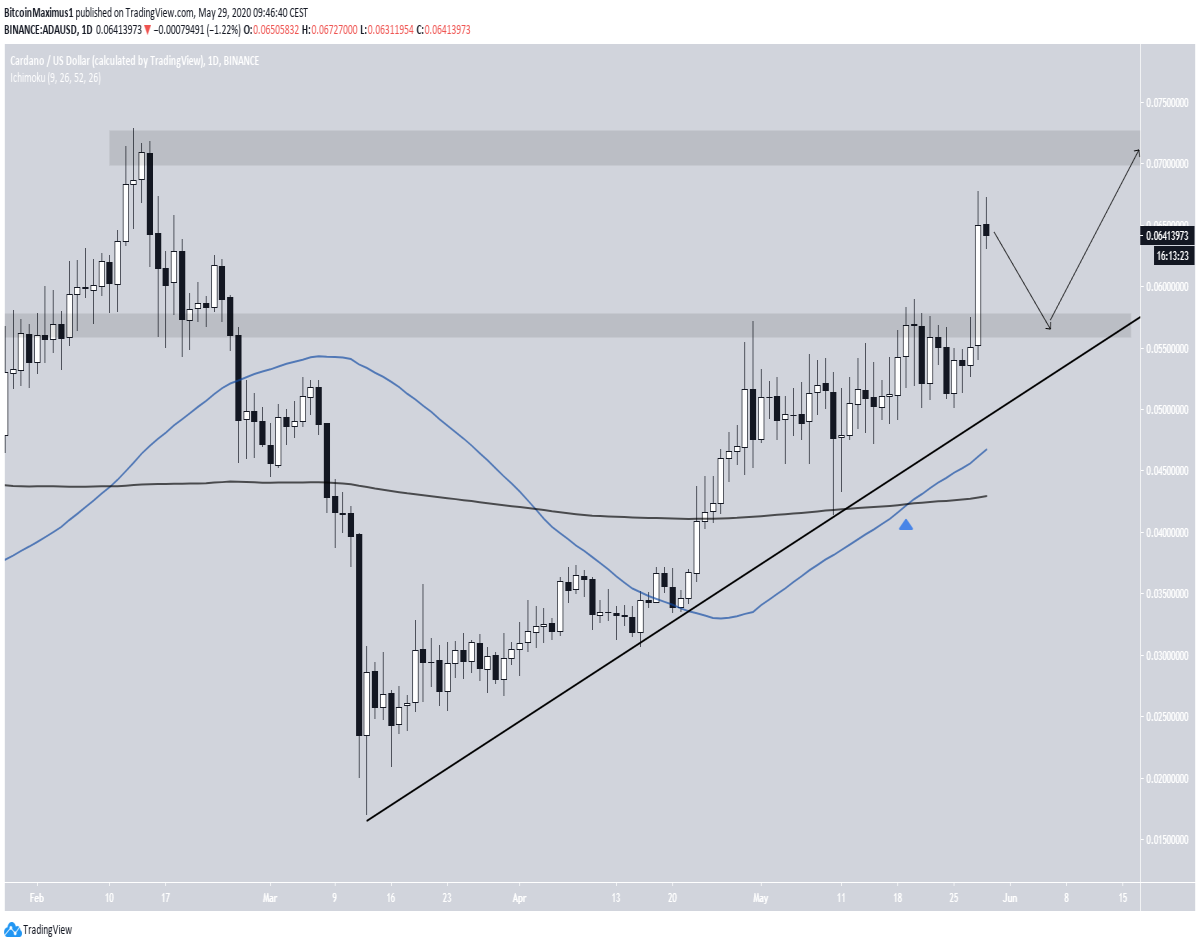
The ADA course found the bottom on March 13 and has since been moving along the line of upward support. The market last tested this line on May 10, and since then the pair has been growing, and the pace of this growth has only accelerated.
On May 28, a bullish breakthrough of the resistance area of $ 0.056 occurred, which can now begin to act as a support. The next nearest resistance level is at $ 0.071, and now the price is trading between these two levels.
Meanwhile, the 50- and 200-day moving averages (MAs) formed a bullish crossover and the pair is above these lines.
As long as trading continues above this line of upward support and both MAs, price dynamics will continue to be considered bullish, and the price may try to make a resistance breakdown of $ 0.072.
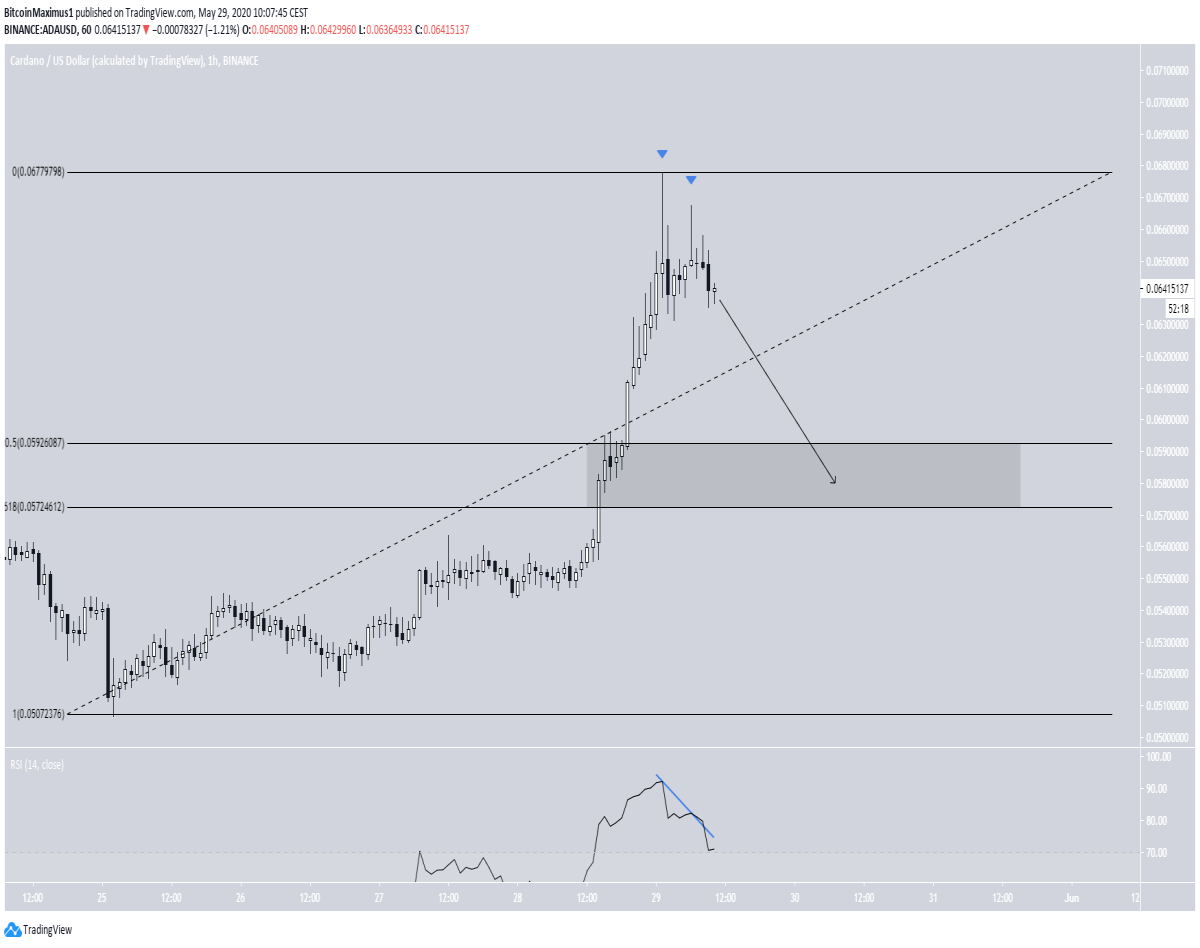
Meanwhile, on shorter charts, the ADA has formed a double top, known as a bearish reversal pattern. In addition, on the chart, you can see the long upper wicks, and the RSI indicator gives signals of a bearish divergence.
This indicates that the price is likely to head south and only then make another attempt at a bullish breakout.
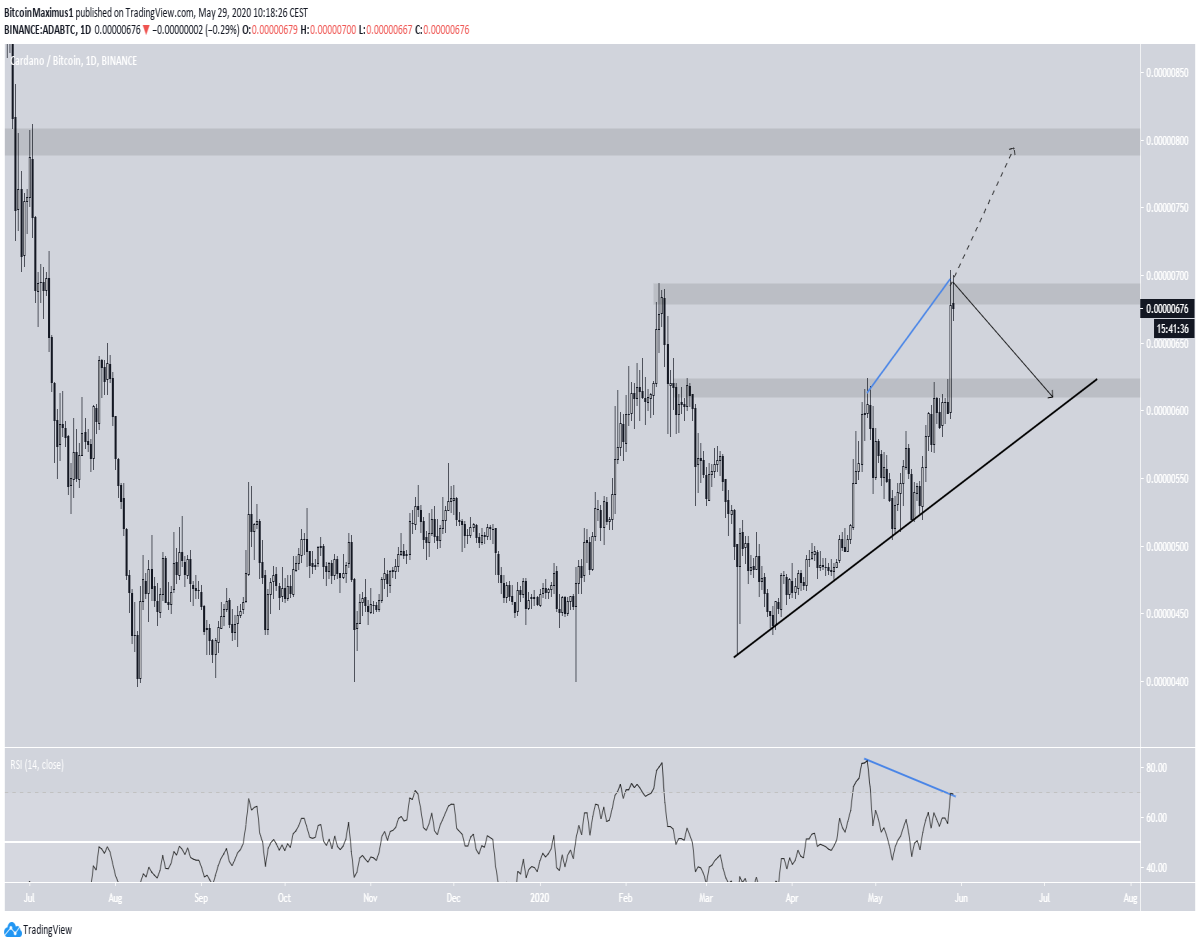
ADA/BTC
The ADA / BTC pair behaves similarly. The price also moves along the line of upward support, last touching it on May 18.
At the time of writing, the pair was trading inside the resistance area of 690 Satoshi. Taking into account the price dynamics of February, we see that the market has formed a double top.
In addition, the RSI here also gives signals of a bearish divergence, albeit on shorter timeframes compared to the double top chart.
Thus, the price may return to the line of upward support to test it again, and only after that will try to make a bullish break again. Perhaps in the process an ascending triangle will form on the chart.