
Bitcoin is trading well above $20,000, and according to historical patterns, trades may no longer return to the 5-digit area.
And while a convincing break above $20,000 was proof enough of a massive rally, the relative strength index also broke into a bullish area for the first time since 2018.
Bullish mode: the Relative Strength Index has finally reached bull market levels
Yesterday, December 17, 2020, exactly three full years after peaking in 2017, Bitcoin attracted increased interest again.
In the year of the previous high, the leading cryptocurrency rose from $1,000 to $20,000.
In a magical (or logical?) way, on the anniversary of the previous peak, Bitcoin confidently overcame the psychological barrier, setting a new record 20% higher. And if that signal wasn't enough to make the world aware of the start of a new bullish rally, the asset's relative strength index provided further confirmation.
For the first time since the start of the bear market, the monthly RSI is in a bullish range. In the chart below, similar control conditions are ticked off:
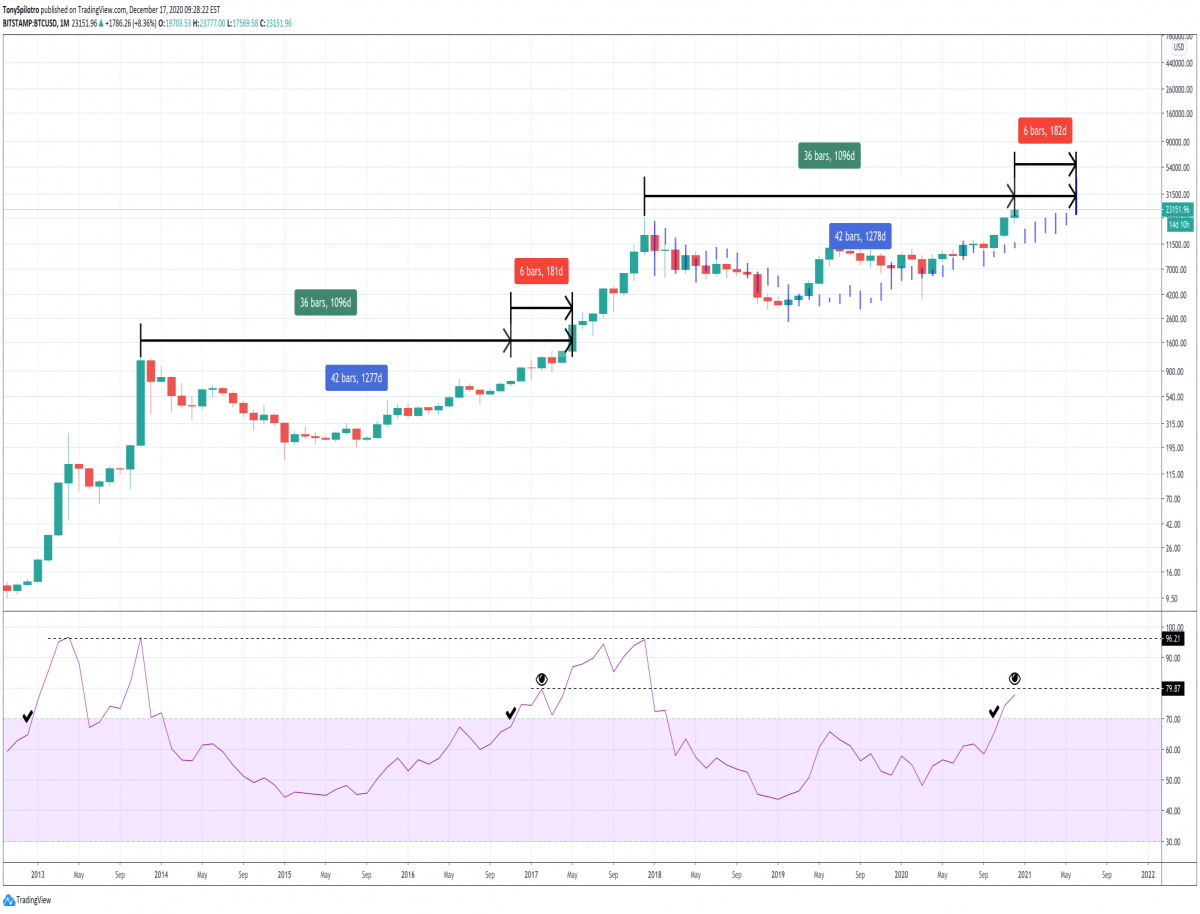
It is noteworthy that the cryptocurrency has almost reached the point of the RSI trend development, at which the first red candle appeared. This happened in December 2016.
Historically, December has been an important month for cryptocurrency in terms of cycle development, serving as an important turning point for price action.
Bitcoin bubble: bulls are 6 months ahead of the rally schedule
The cycles of the Bitcoin bubble inflating are explained by the unique mechanism of shrinking rewards for mining the block, which is the basis of the asset's scarcity. The idea is that, unlike gold and other commodities whose supply can be increased as demand increases, Bitcoin's supply actually decreases.
In such conditions, in 2020, the process of price disclosure began on the market of the leading cryptocurrency. This can continue as long as the level of speculation does not exceed utility,and the bubble bursts, giving rise to a new cycle.
The 4-year intervals make these cycles somewhat predictable, and 2020 has reaffirmed this pattern. If the trend continues to follow the same trajectory, a parabolic phase and cosmic prices for Bitcoin await us.
However, there is one thing bulls should be concerned about, and that is the fact that this cycle is already more bullish in nature than it was in 2016-2017. This may indicate that the market is overheated. In the above chart, you can see that the bulls are six months ahead of the growth chart.
With such a small amount of data to analyze, it is impossible to predict what will happen next, especially given current unique macro factors such as unprecedented money printing and FOMO of institutional investors.


