
Upland Transactions Analytics
Hello everybody and welcome the the first episode of the series Upland Transactions Analytics!
Before we dig into all the "boring" details some things needs to stated or clarified first:
- Data is publicly available on Up2land.com or Upx.world
- This article is not about finding multi accounts or cheaters as in the game you have lots of communities/groups which are conducting businesses and property exchange and lottery and so on, but is only about to show how the market is performing. Is about statistics and about free information collection and provided to the people in a different way. So, if someone is finding himself presented here in this article, should not be offended as everything is just data, public data.
- If you like what you will find in this article, please vote using the rate button
- With just a click you can help the Upland Chronicles to continue and tip the Chronicles using this button

- If you want to support the Upland Chronicles even more, feel free to donate some coffees here(all donations will be reinvested in the branding of the Chronicles): Buy Me a Coffee
Upland Transactions Analytics
Now is the time to start presenting all the information gathered.
Please be advise that all presented statistics are from this time slot: Start time: 7/2/2021 End Time: 7/24/2021 (22 days period)
In the 22 days period there were 237470 transactions made which is almost amazing as it makes around 10793 transaction per day.
Biggest city as transaction percentage is by far Cleveland(39.63%), followed by Chicago(32.08%) and at a large distance Bakersfield(9.11%).
All this data is normal as these 3 cities still have a lot of properties unminted and also we had several contests provided by Upland team, especially for Chicago and Cleveland.
The overall data is provided in the image below(fig.1) with all the cities present now in Upland Metaverse.
Fig. 1
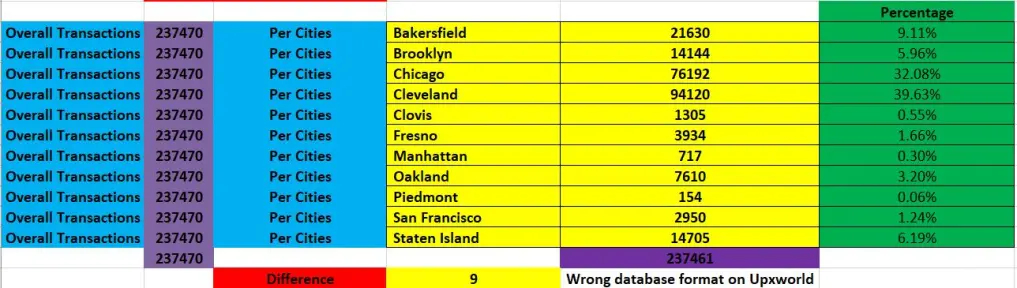
Next we will provide more in details the information from above(Fig.1).
We will do an analysis for each city in alphabetical order so, first deeper analysis will be for the city of Bakersfield.
BAKERSFIELD

First, some information about Bakersfield provided by Google:
Bakersfield is a city on the Kern River, north of Los Angeles. Displays at the Buena Vista Museum of Natural History focus on geology and paleontology. On the city’s northeastern edge, the California Living Museum explores the state’s flora and fauna, and has a reptile house and a touch tank. Northeast, trails wind through the mountains of the Kern River Ranger District, part of Sequoia National Forest.
In the city of Bakersfield we had 21630 transactions out of total of 237470 resulting a 9.11% of all transactions and a median of 983 transaction per day.
Bakersfield 21630 9.11% 983
Out of those 21630 transactions, 15627 were minting new properties, 4878 pure buy transactions and 1125 new offer sent to the seller(accepted offers). We have:
- cheapest mint 656 UPX and most expensive mint 15.000.000(Bakersfield Clock event).
- cheapest buy 1 UPX and most expensive buy 2.629.880(sothbys for a property in San Lauren)
- cheapest accepted offer 1 UPX and most expensive 5.225.000(ifily bought a property in Downtown)
You will find the details in Fig.2 below also the median prices:

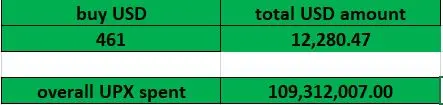
Overall UPX prices spent in all transaction in the 22 days period: 109.312.007 UPX
We had also transactions with USD, a total of 461 transactions resulting into approx. 12.280USD spent which for a city of the size of Bakersfield is a good amount.
This data is presented in Fig.3 below:
Now, let us focus our attention on BUY with UPX data: 4417 total transactions were performed. Let us have a look at mint percentage price in Fig. 4:

Situation is quite normal per say with a majority of 95.04% transactions above 100%(mint price).
In the below figures you will see the situation per each percentage interval:
0-10%
20-30%

30-40%

40-50%

50-60%

60-70%

80-90%

90-100%
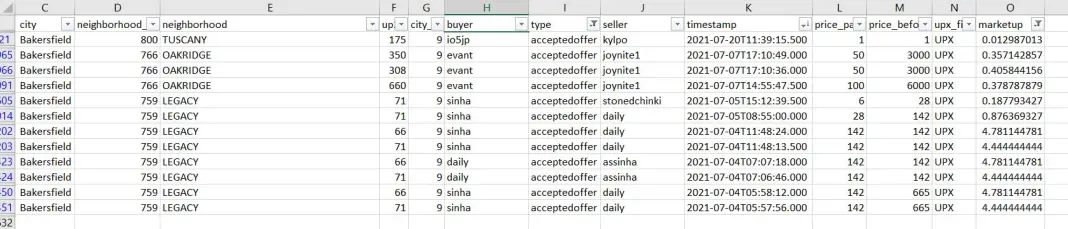
Same presentation as above will follow now for Accepted Offers data: 1125 total transactions were performed. Let us have a look at mint percentage price in Fig. 5:

Situation is a little different per say from the buy with a majority of 65.87% transactions above 100%(mint price).
In the below figures you will see the situation per each percentage interval:
0-10%
10-20%
20-30%
30-40%
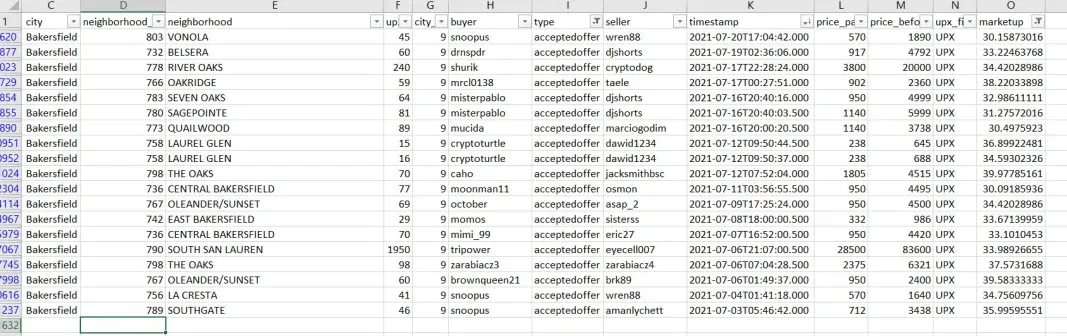
40-50%
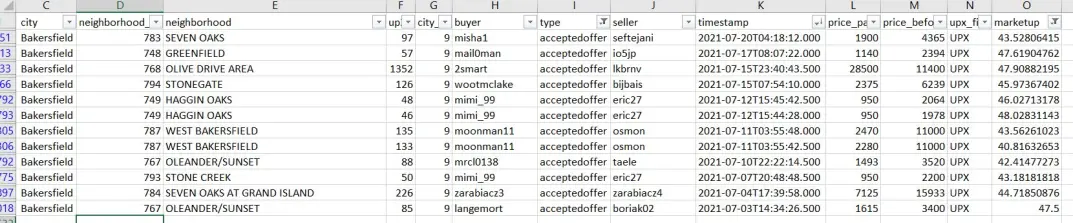
50-60%

60-70%
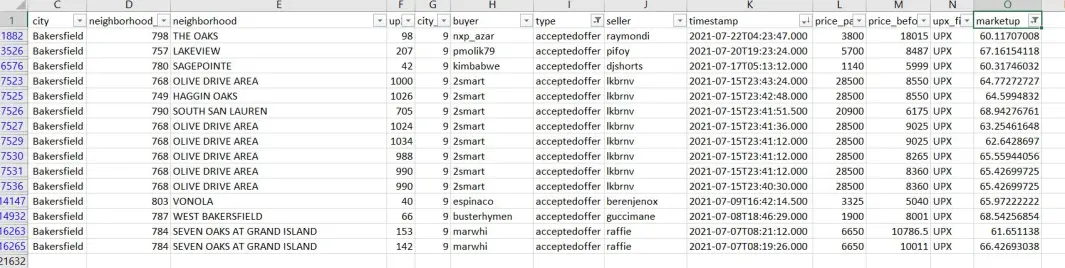
80-90%

90-100%
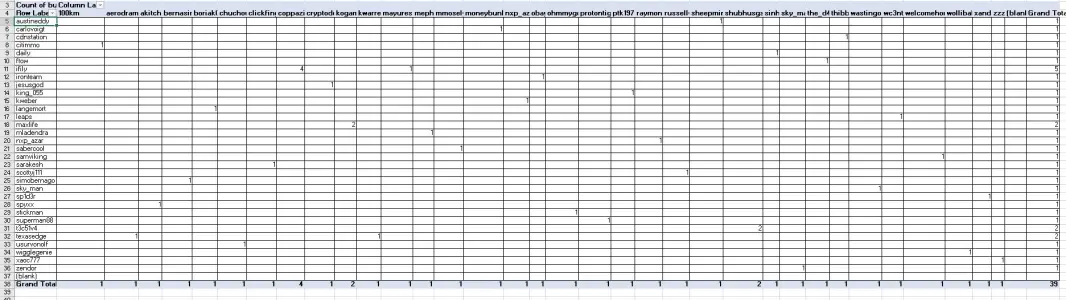
It is time now to present: Neighborhood Statistics
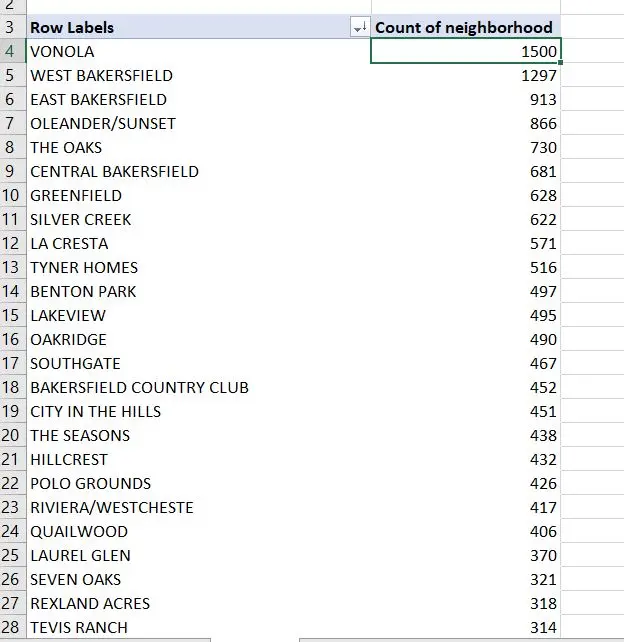
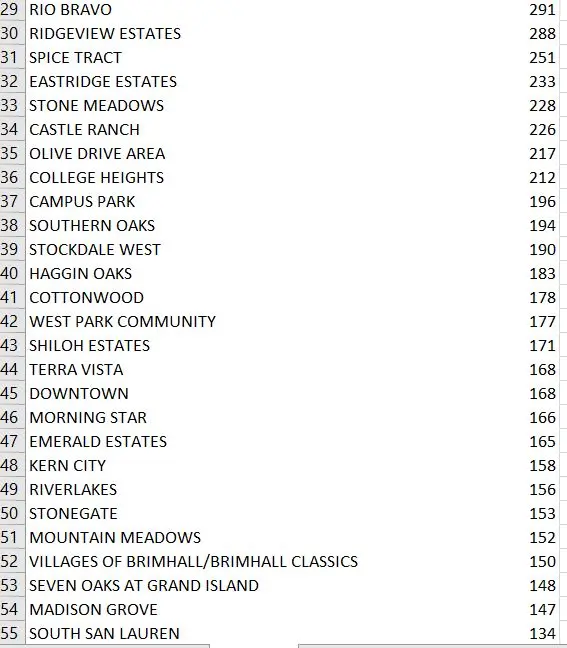
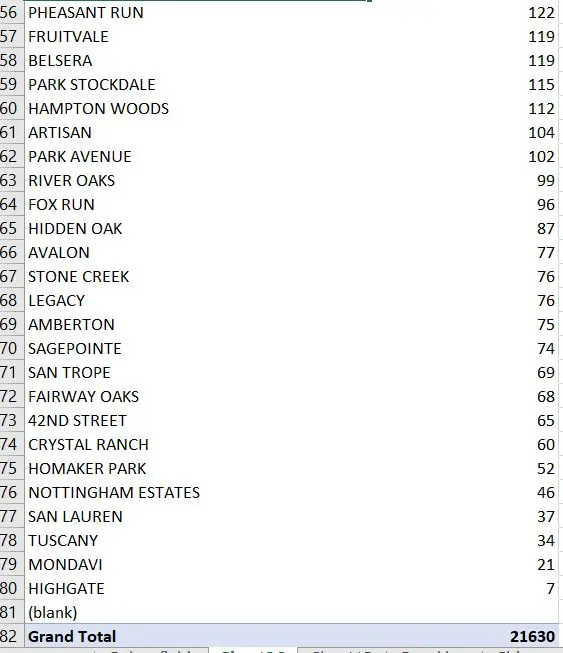
Bakersfield Overall Neighborhood transactions:
Most desirable Neighborhood appears to be Vonola followed at a small distance by West Bakersfield and completing the podium is East Bakersfield.
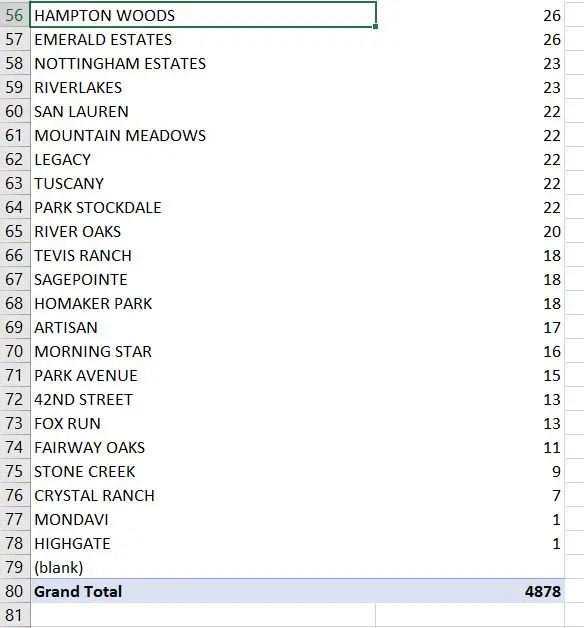
The least desirable appears to be Highgate with only 7 transactions.
Lets look at Buy statistics for Neighborhoods:
On Buy statistics, Vonola still remains the leader but for second place The Oaks surpassed West Bakersfield and Highgate still last position.
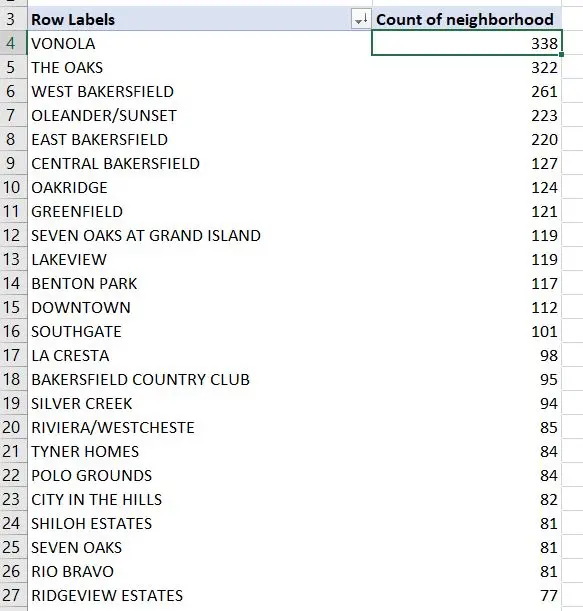
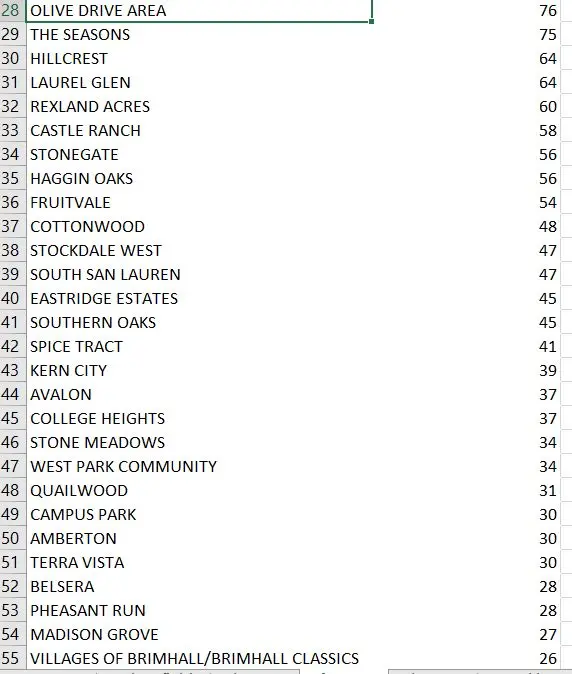
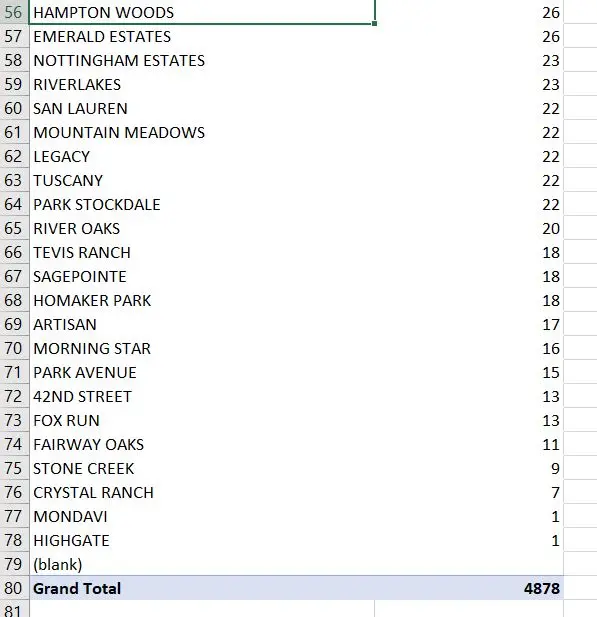
Lets look at Mint statistics for Neighborhoods:
On Mint statistics, Vonola still remains the leader but for second place The Oaks surpassed West Bakersfield and Highgate still last position.
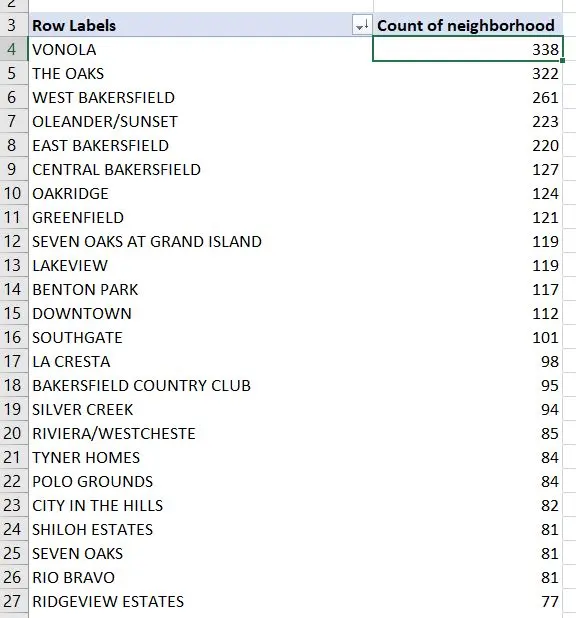
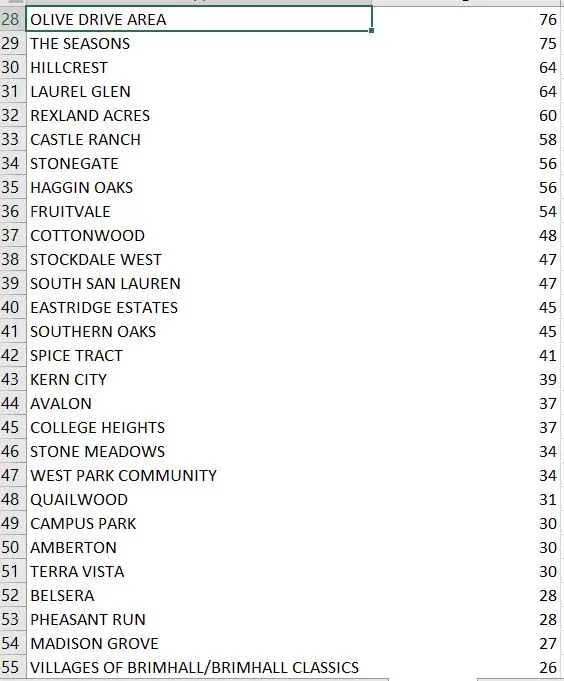
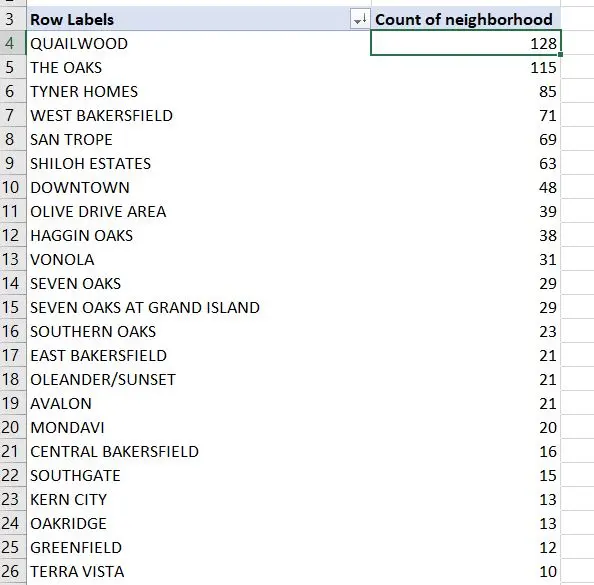
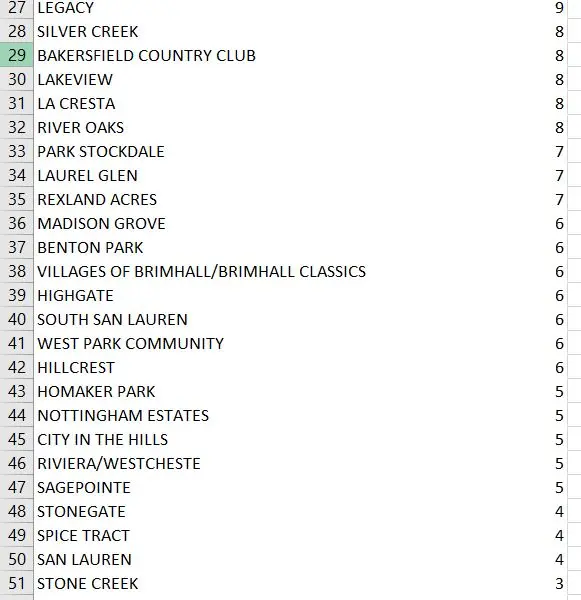
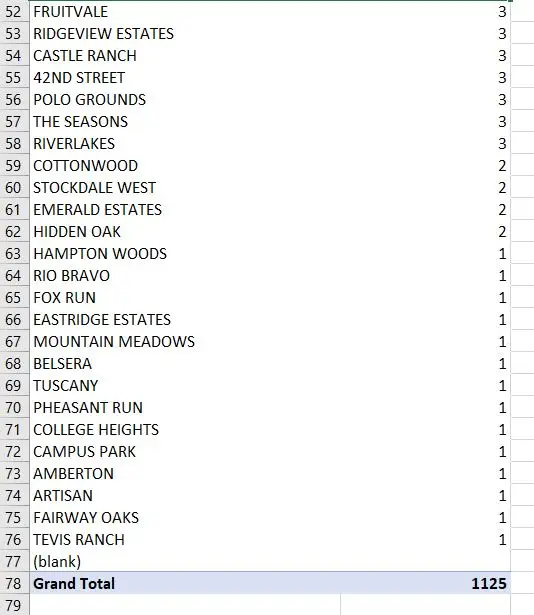
Lets look at Accepted Offers statistics for Neighborhoods:
On accepter offers it seems Quailwood went to 1st position and The Oaks are second followed by Tyner Homes.
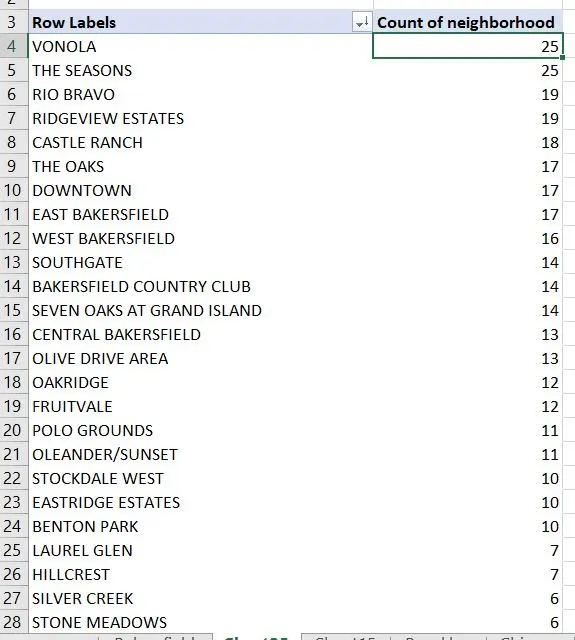
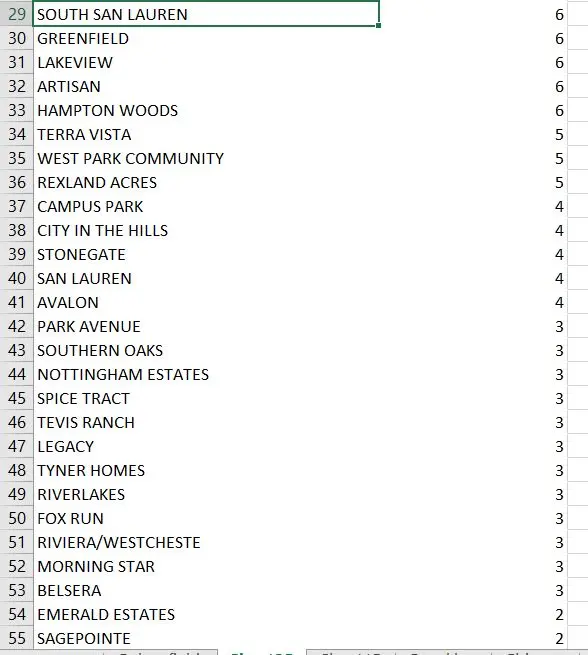
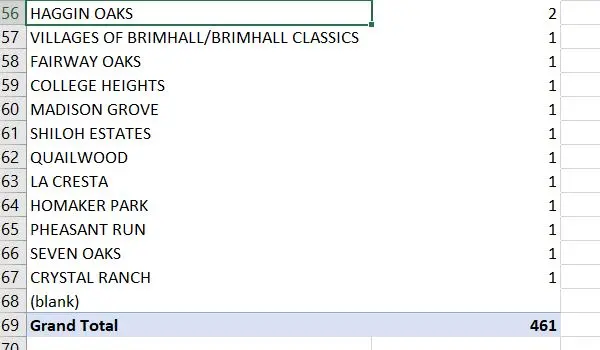
Lets look at Buy USD statistics for Neighborhoods:
Here, Vonola has the lead shared with The Seasons and at a small margin behind are followed by Rio Bravo and Ridgeview Estates.
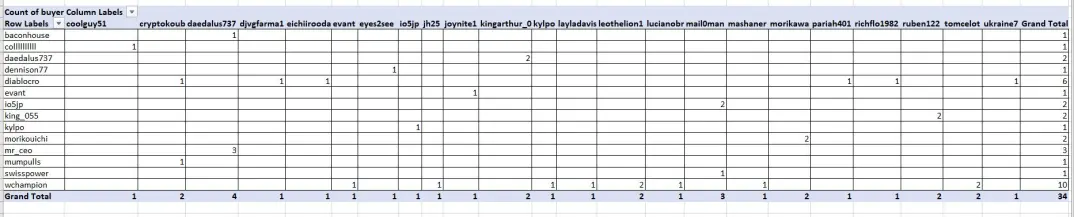
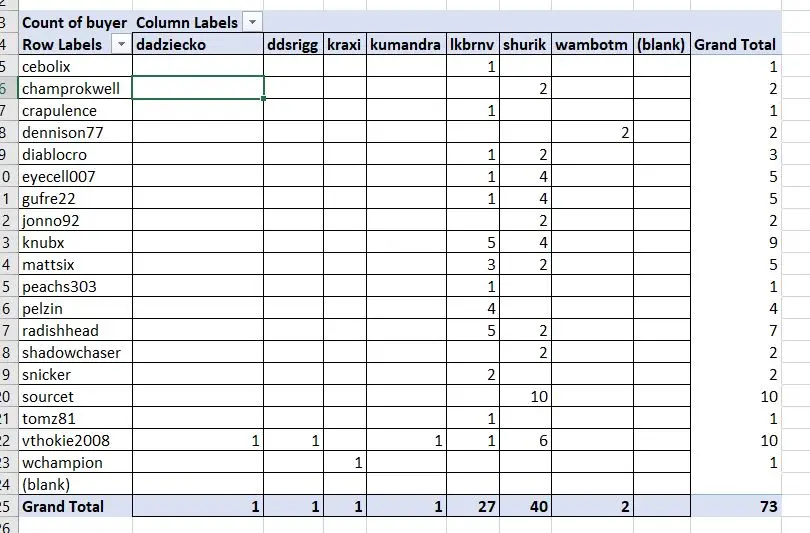
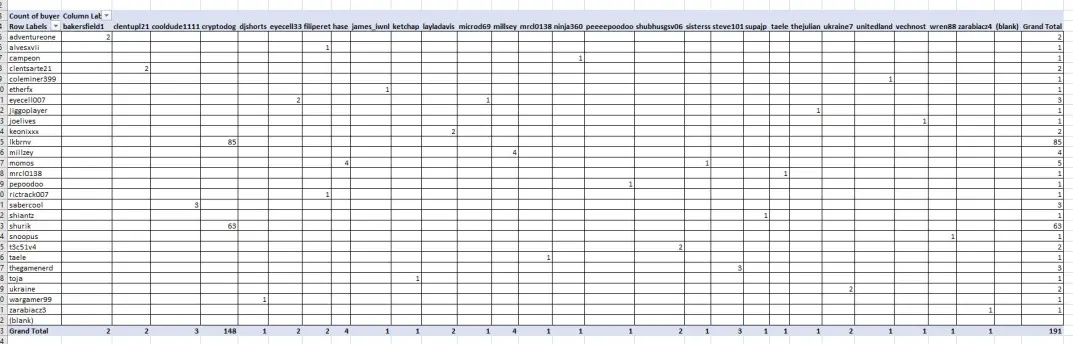
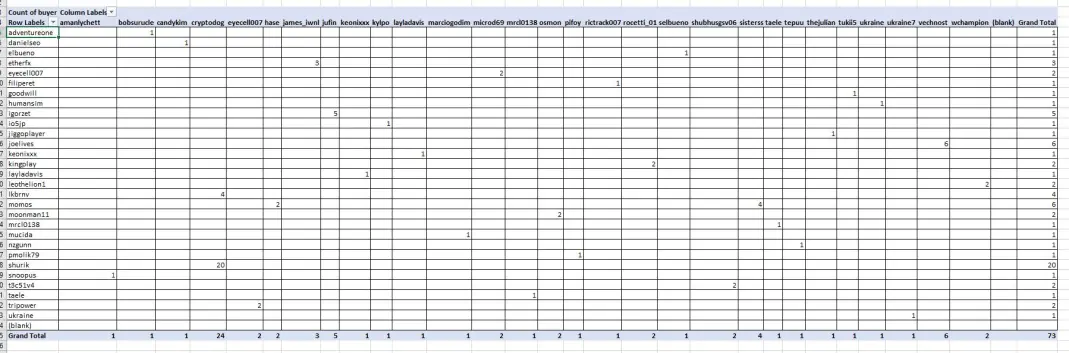
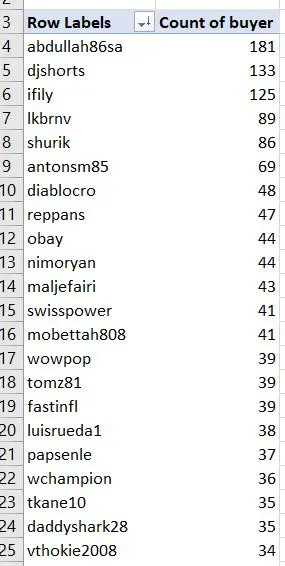
In out timeframe, let us look at the most active buyers and sellers:
Buyers:
Sellers:
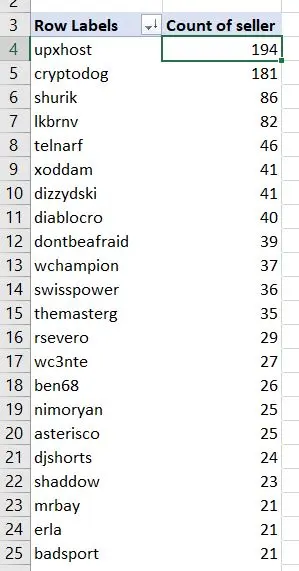
We have arrived at the end of the statistics for Bakersfield for our timeslot: Start time: 7/2/2021 End Time: 7/24/2021 (22 days period)
Soon(very soon actually) the same type of format and statistics will follow for the rest of the cities present in Upland for same time slot.
If you have more in mind about what we can cover or try to create, feel free to drop us a comment and we can try to provide that information to you.






