
At the time of writing, Chainlink has now climbed to $25.37, a fairly impressive move since its drop to $8.03 on 23rd December 2020.
The asset has shown huge volatility in the past few weeks, with the Grayscale news being a catalyst towards its move upwards.
Looking at the Monthly chart, it shows us a clear breakout from the symmetrical triangle contraction in the market’s volatility.
As we had mentioned before in this post: https://www.publish0x.com/ttempo/chainlink-analysis-a-case-for-the-bulls-xerllzr, Chainlink had found strong support from the Monthly 9EMA for the past 6 months.
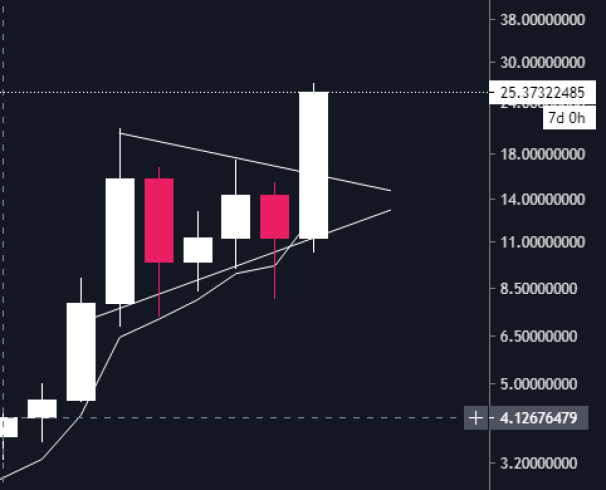
Monthly LINKUSD chart with Symmetrical Triangle Breakout
In the Weekly chart below, we can see how the hammerstick bounce from the 50MA four weeks ago played out beautifully. In bullish markets, the hammerstick candlestick can be an early sign of reversal, especially near a support level.
The LINK market has rejected the lower hammer wick or shadow levels and that has been a positive indication of bullish action as it has markedly showed that demand has overwhelmed supply.
As we see below, the hammer at the end of the week ending on 27th December bounced off the 50 Moving Average and was a massive sign that the bulls were ready.
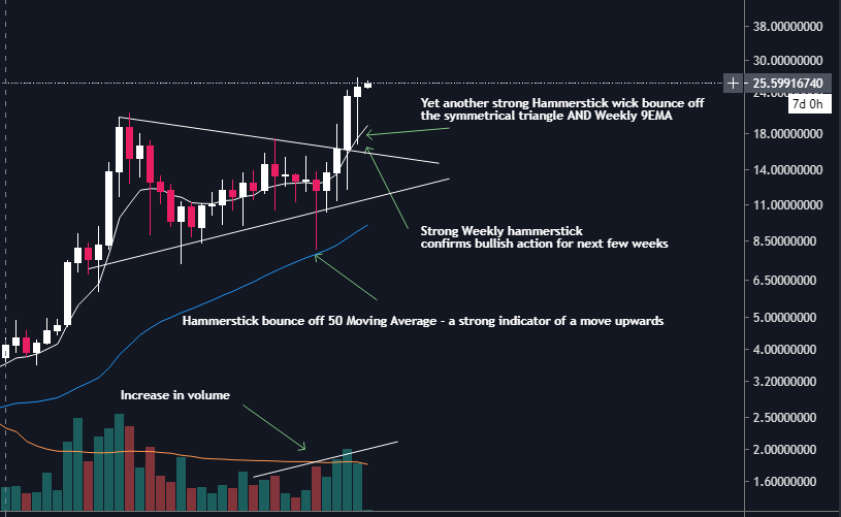
Weekly LINKUSD chart
Although we may still see a retraction towards its new support levels at $20.71 and $18.83, it's highly likely that those levels would act as strong support.
Volume has also increased for the last four weeks, with the volume building momentum and last week closing above the 50 Moving Average for the fist time since August 2020.
Using the Fibonacci Retracement tool below, the next levels to watch would be $28.18, $29.89, $32.39 and $35.55.
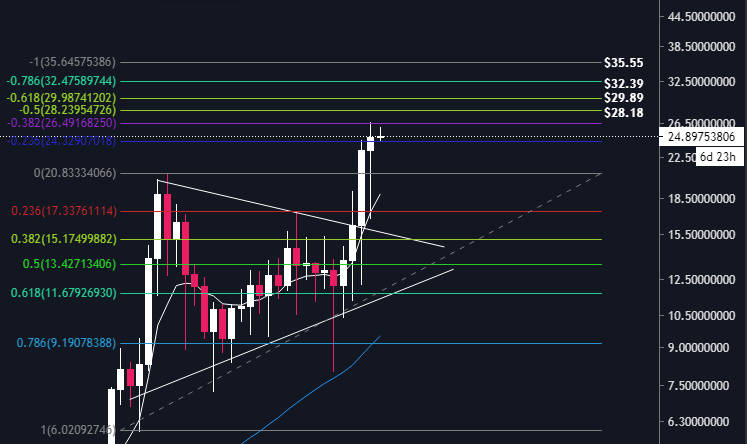
Levels to watch - $28.18, $29.89, $32.39 and $35.55.
Now that Chainlink is in price discovery, these levels could very well be achieved sooner than we think.


