
With Bitcoin currently at $31,600K and having some kind of consolidation after the recent parabolic move, Chainlink and other altcoins are looking to play catch up.
At the time of writing Chainlink is trading at $14.29 and at ₿0.00043329. We will be looking at the bullish case for Chainlink against both the USD and BTC.
Looking at the Monthly LINK/BTC chart we can see that Chainlink has held support.
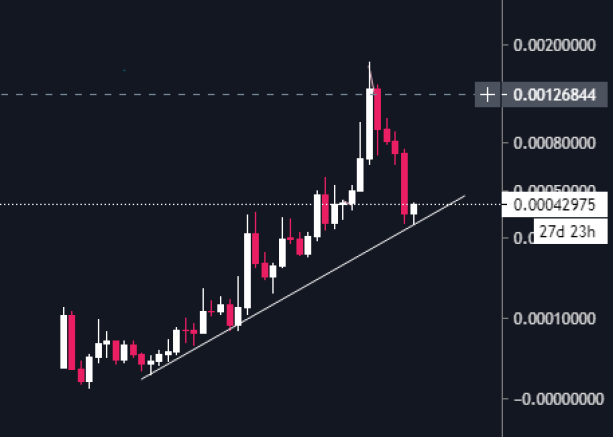
LINK monthly chart
Zooming into the Weekly LINK/BTC chart below, the 0.786 Fibonacci level has held and is bouncing up. Usually the 0.786 levels are valuable points and normally great support for bullish markets.
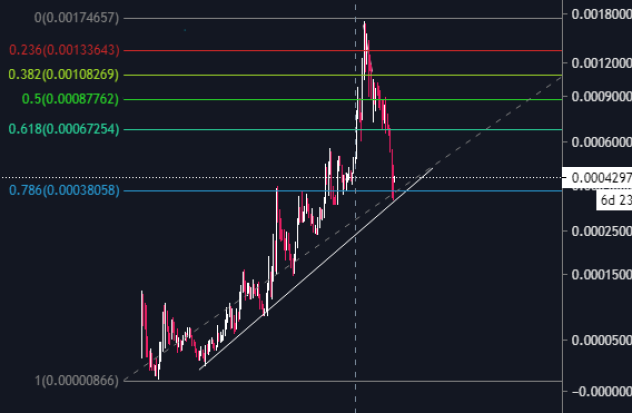
LINK/BTC Weekly Fibonacci 0.786 support
Moving onto the Monthly LINK/USD pair, the current price has risen to $14.27 and the asset has held the 9EMA Monthly support lately. As mentioned in the last article, the monthly 9EMA is a strong indication of bullish momentum possibly continuing.
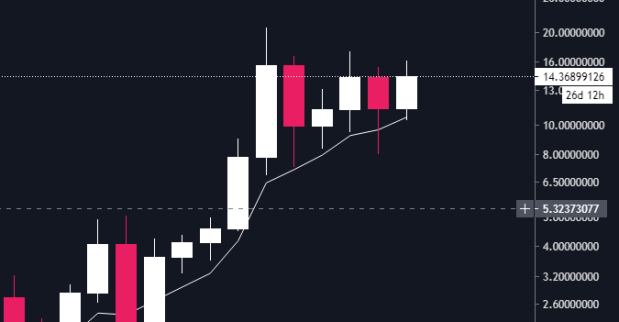
9EMA has held on the Monthly chart
On the Weekly LINK/USD pair below, Chainlink has in recent weeks, found resistance between $16.60 AND $17.30. Any close above $17.30 is a good case for the longs. The symmetrical triangle has held well and is another strong case for the bulls. We can see that whenever the price hits the bottom of the symmetrical triangle, the Weekly candle ends with a strong hammer candlestick, another bullish indicator.
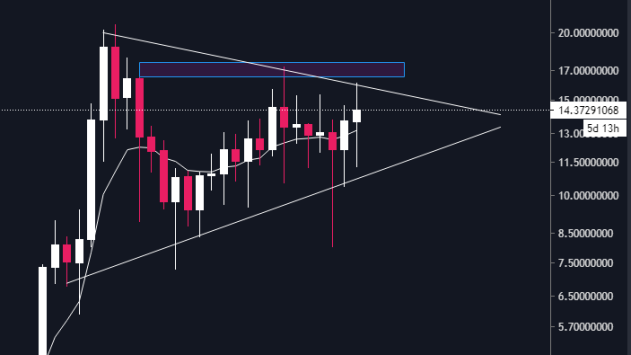
Symmetrical triangle resistance
Inputting a Fibonacci Retracement on the Weekly LINKUSD chart with the highs of August 2020 and lows of September 2020, demonstrates how key the 0.786 levels are if the $17.30 resistance is taken and shows that the same levels is key resistance to be broken if LINK is to move to the upside. Any daily close above these levels is a good indicator of a further move up.
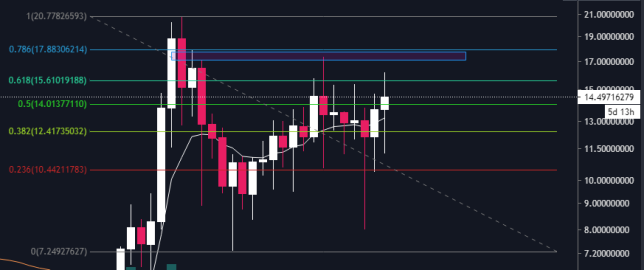
LINK/USD $17.30 resistance
Zooming in into the Daily chart, as noted in the previous post, LINK has managed to bounce off the Daily 200MA strongly and we have seen before that when LINK touches the 200MA, it coincides with major moves upwards. The 200MA is a strong indicator of bullish momentum continuation.
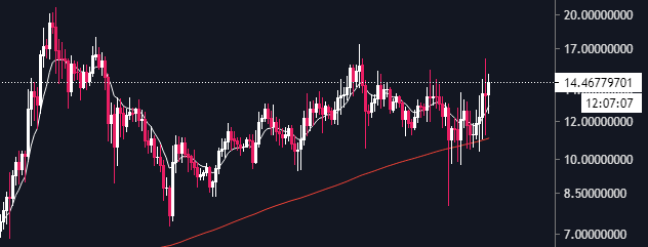
Daily 200MA bounce
Overall, the charts look bullish with current Monthly support recovery and Daily 200MA support confirmation.
Become an affiliate:


