
This is a quick reference guide new & experienced investors can look back on anytime they need it.
The article is a checklist of things to learn or remember if you need a quick refresher!
The TOP
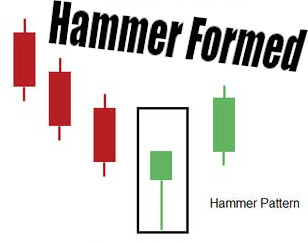
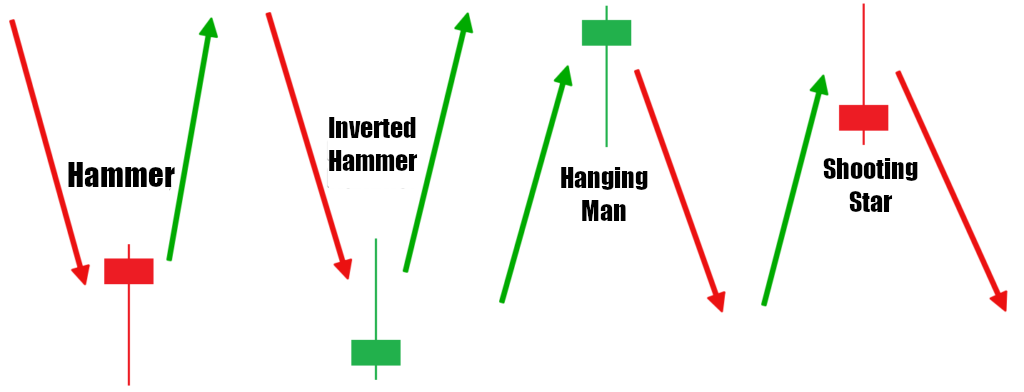
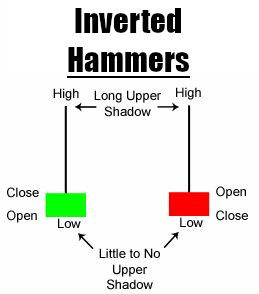
1. Hammer Formed
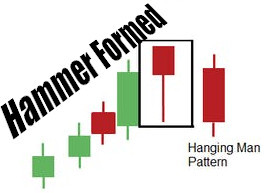
If you see a hammer of any kind, you better be ready to make your move.
The rise has been happening and sometimes it is a massive rise.
A hammer during a rise could potentially mean that figurative hammer is coming down now.
This may not always be the case but it definitely one good indicator that it may be a good time to sell at the top.
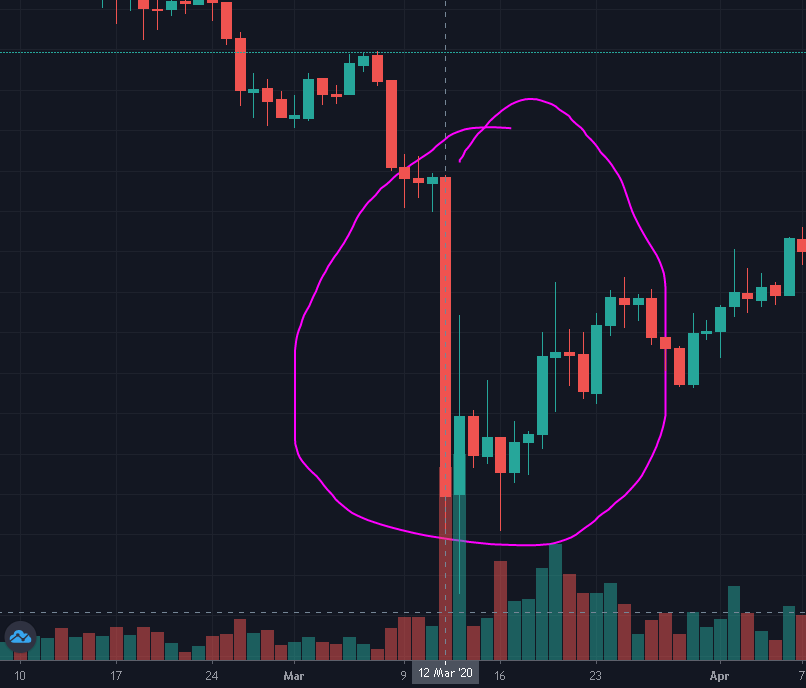
2. Large Parabolic Move Upwards
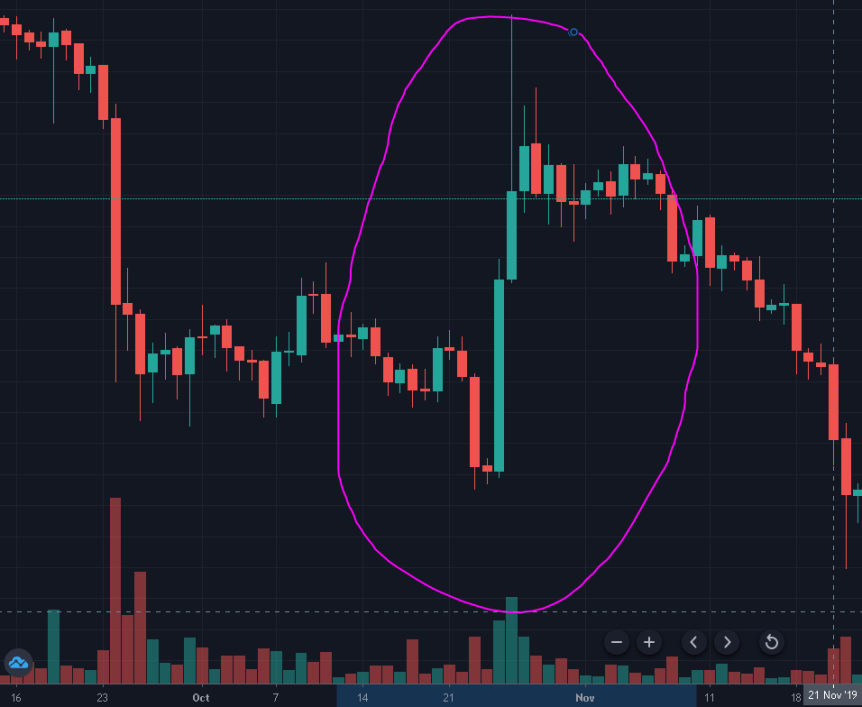
This example was taken during the end of October 2019 and shows a few good parabolic moves on the daily.
Most notable are the 2 that are inside of the pink circle.
There is a rather large parabolic move down, followed by an even bigger parabolic move upward.
Parabolic for those wondering is just a fancy word for a U-shaped curve, usually larger then the parabolic curve before it.
In this graph above we see curves signaling both a bottom curve and then immediately after a top curve.
Ride those parabolic waves bruhhhhhh
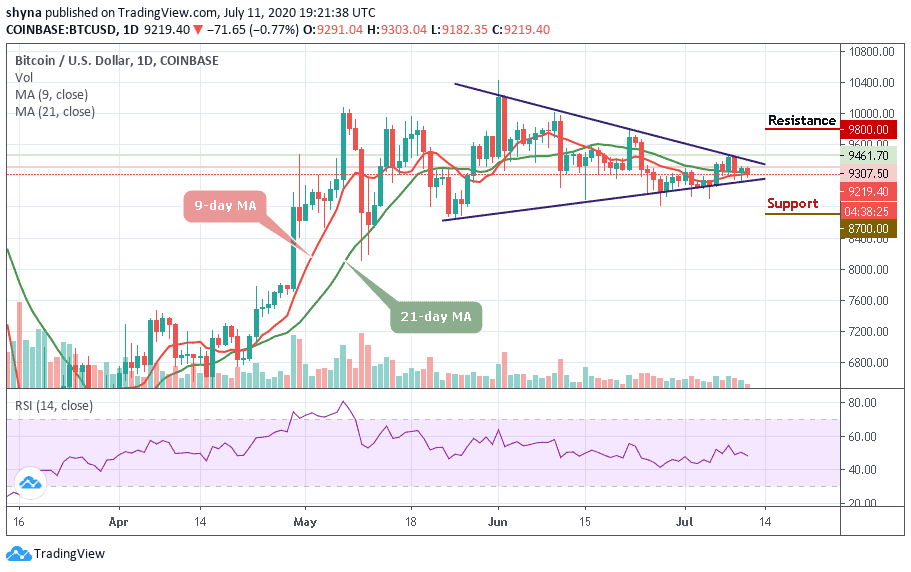
3. Support Levels Start Turning Into Resistance Levels

(source: https://insidebitcoins.com/wp-content/uploads/2020/07/BTCUSD_1D_10072020_b.png)
In this graph above we see an example of the price about to Squeeze and it is about to break through Resistance or Support!
Resistance and Support levels can be tricky at first to understand or find for ourselves.
There are many resources out there for people predicting what resistance and support levels are.
While it may always be handy to get the expert opinion of others.
Recognizing Support & Resist levels first hand is a skill that is far less from wasteful!
When a price blasts through Resistance levels on the way up.
It won't go up forever!
To spot the top you will need to be able to recognize Resistance and Support levels in real-time.
When the price stops going up after a sudden rise, it is because it has finally met Resistance.
Resistance levels that were broken will turn into Support as it goes upwards.
After everything breaks Resistance levels, the Support levels will start to break down again.
The moment Support levels start turning into Resistance levels you can take some nasty profits if you are quick!
For example!
If in this graph the price shoots up to $9800 where the Resistance is.
It breaks out of $9800 and goes to $9900.
Now $9800 turns into Support and $9900 becomes Resistance.
But if Support breaks $9800 and turns into Resistance again.
It's probably top.
Sounds easy yes!
However, there are a lot of things to know about when it comes to Support and Resistance levels!
4. Lower-highs
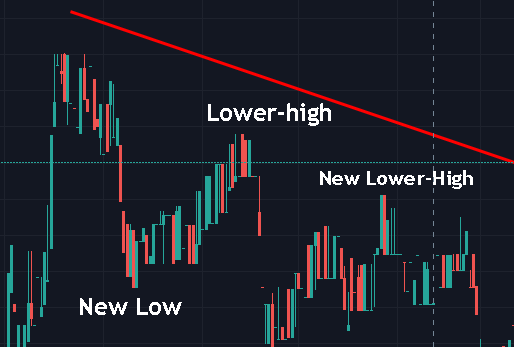
At the beginning of this picture is a Lower-high
To the left of it was a Top!
To the right of the Lower-high is another Lower-high.
The price is surely going down now I suppose 😥
5. Lower-lows
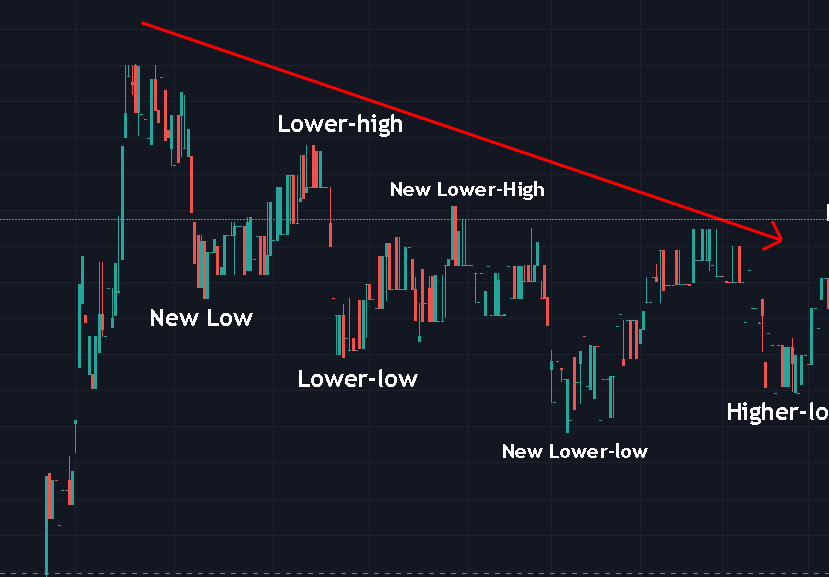
We have Lower-lows to take into consideration as well.
It is pretty easy to tell from this picture the trend of Lower-Lows
The New Low on the far left comes down lower and lower.
Three new lows are found!
It WILL happen too!
Maybe not quite how it looks like in this example but if you Sell at the right time.
You will have another chance to buy back in at a lower price.
That chance could be anywhere from within a minute, to an hour, to a day, to a week, a month, a year, etc.
Take profits as much as you can when you can!
Selling too early happens so do not beat yourself up for it.
It is better to have made a little than not to have made any at all ✌
The BOTTOM
1. Hammer Formed
The price is going down and a hammer-like, saucy green, thing, appears.
A Bottom may possibly be starting to form!
The hammer has struck and is going to start beating the price up.
2. Large Parabolic Move Downwards
Trevor and his dang parabolas 🙄
In this move down to the Bottom, we can see a notorious dip.
The curve on this is so steep and stretchy that it spotting the Bottom would have been apparent to everybody for about 7 days.
A whole week!
If you didn't notice, the date on this parabolic red Bottom was from the March 11th, 2020 COVID-19 induced sell-off of everything.
After a few moves downward a humongous line forms like this.
You should have reserves to pump back into your assets as soon as you think the Bottom has formed.
3. RSI Remains The Same After Parabolic Move
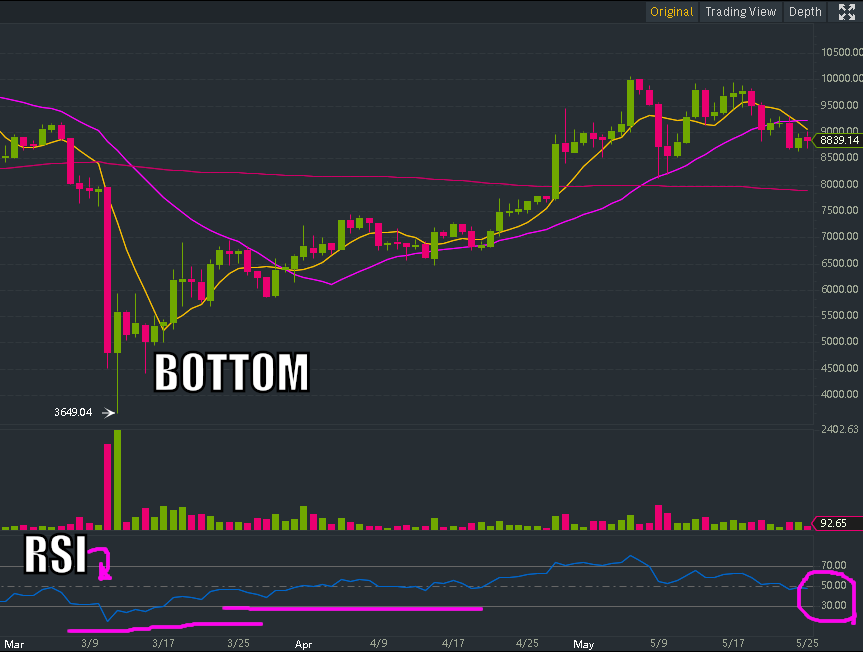
Using the same example from March 2020, we have the RSI.
The little blue line steadied out at 30.00 RSI right before it dipped again pretty bad.
This last and final dip recovered very quickly back to about 30.00 RSI again.
It rose back up to above 30.00 RSI and 40.00 RSI.
The RSI will remain relatively the same as it did just before a big move happens.
This can also be used to spot tops or good sell-off points!
The example here is a more dramatic example to show in order to see visually what it looks like.
4. Higher-highs
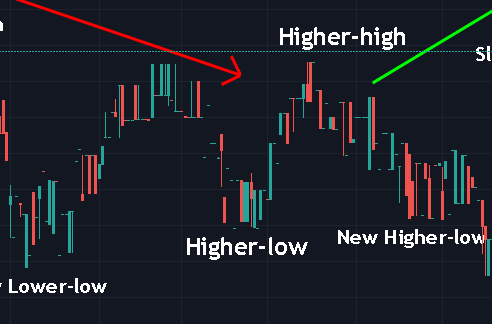
Higher-highs will form which good signal you to the fact that the price is willing to go higher now.
After descending, a Bottom can be spotted by looking for Higher-highs.
This Example above is an example of a Higher-High that just barely beats old high before it.
These can be difficult to spot surprisingly!
They can be spotted in minutes, hours, days, months, years, and so on.
Spotting the right ones and the right time definitely will help your investments!
5. Higher-lows
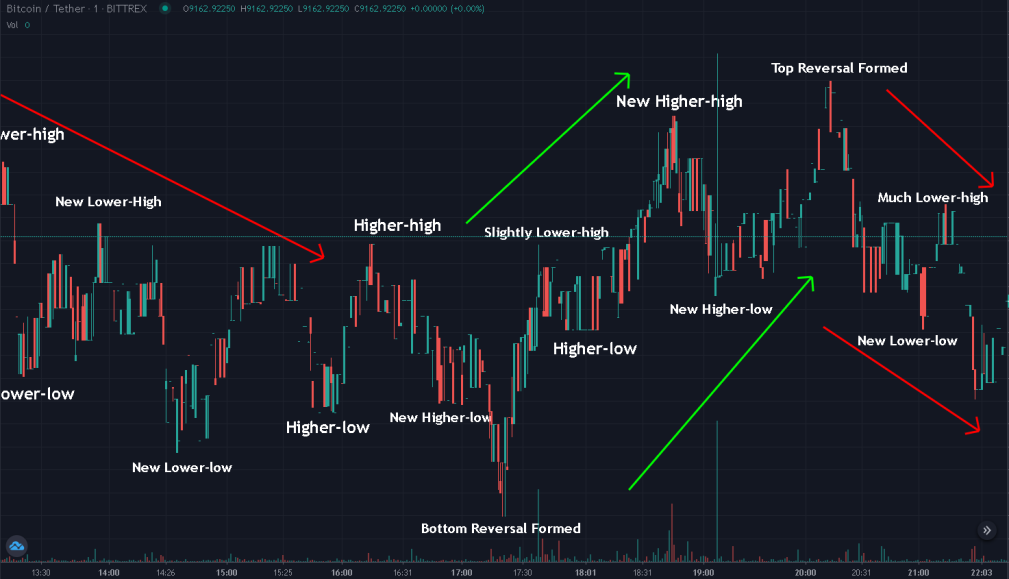
This is a larger graph from previous examples in order to help recognize the flow of Tops and Bottoms
When Higher-lows form, the price is likely able to go back up if yet another Higher-low is formed.
In this graph above, there are 4 total Higher-lows 😲
If a Higher-low is formed after a new low that is also a big sign that the bottom has ended just like in this example.
Bonus Tip:
FULL CHART EXAMPLE:
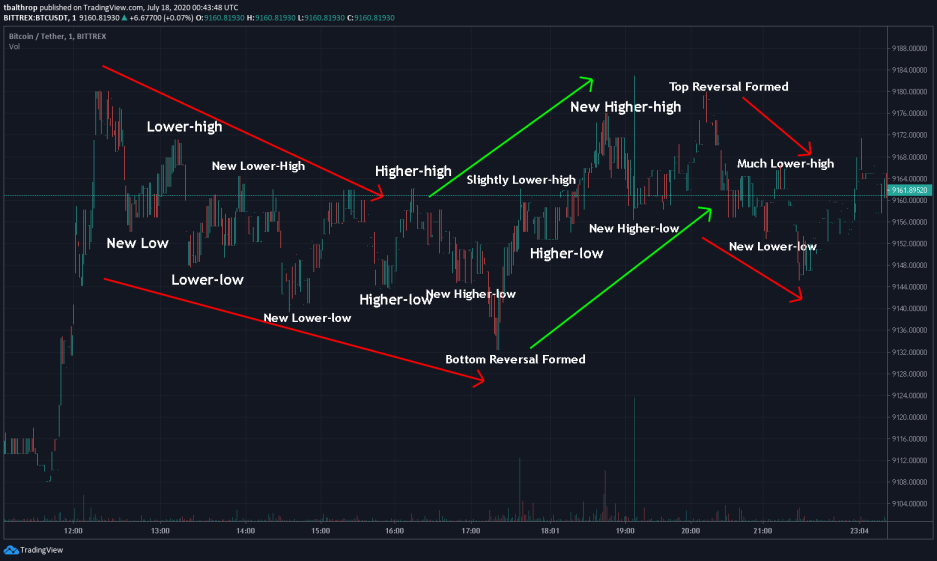
(source: https://www.tradingview.com/x/AClQrNdN/)
Thank you for reading, be safe, and be skeptical!


