
HEYYOOOO out there in the world of Bitcoin!
My name is Trevor and today is the day we have all been waiting for!
The official update to Bitcoin's Monthly Historical Chart 😎
Behold!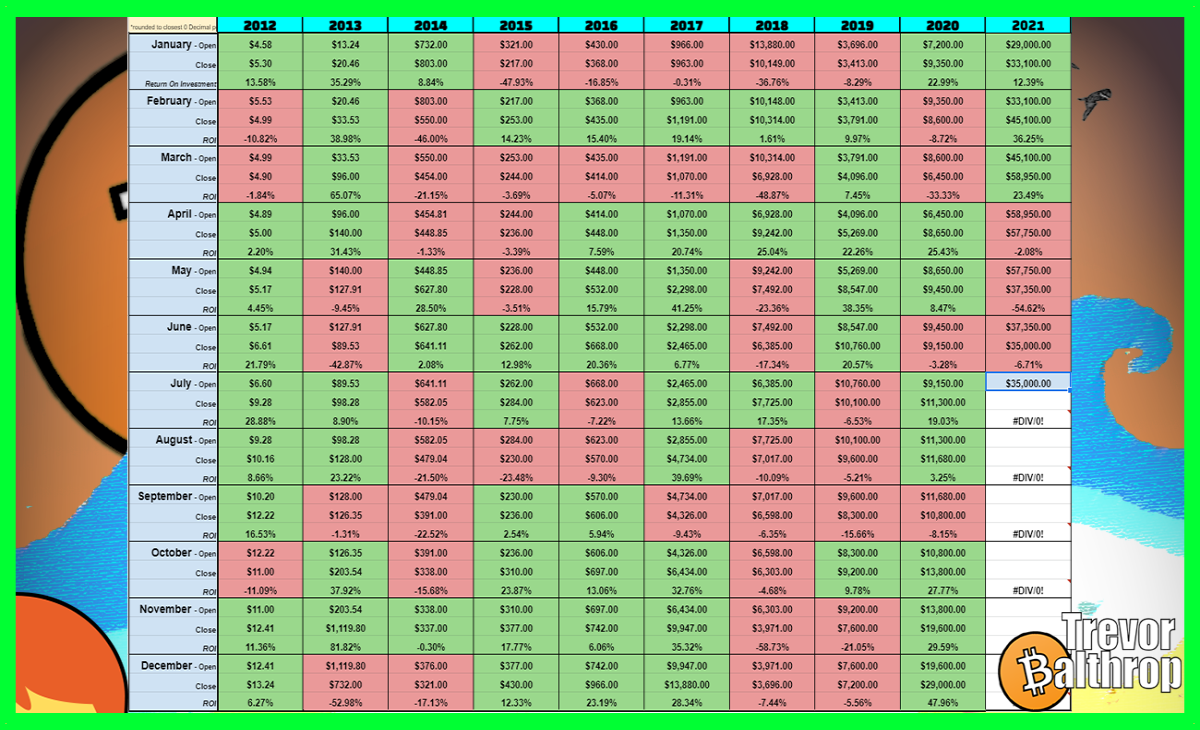
Bitcoin's Monthly Historical Chart
I have continued to update and will continue to update it for everyone each month with the latest results.
Instead of looking at bar graphs and TA all the time.
This chart helps gives us another perspective on Bitcoin that a lot of people miss seeing.
For those that are not familiar with this chart, I will quickly explain!
Each box is color-coded Red or Green to indicate how Bitcoin performed for the monthly close/open.
When Bitcoin opens at a price that is lower than the previous month, it performed negatively and the box is marked Red.
When Bitcoin's price closes at a price higher than the previous month's open, it performed positively and the box is colored Green.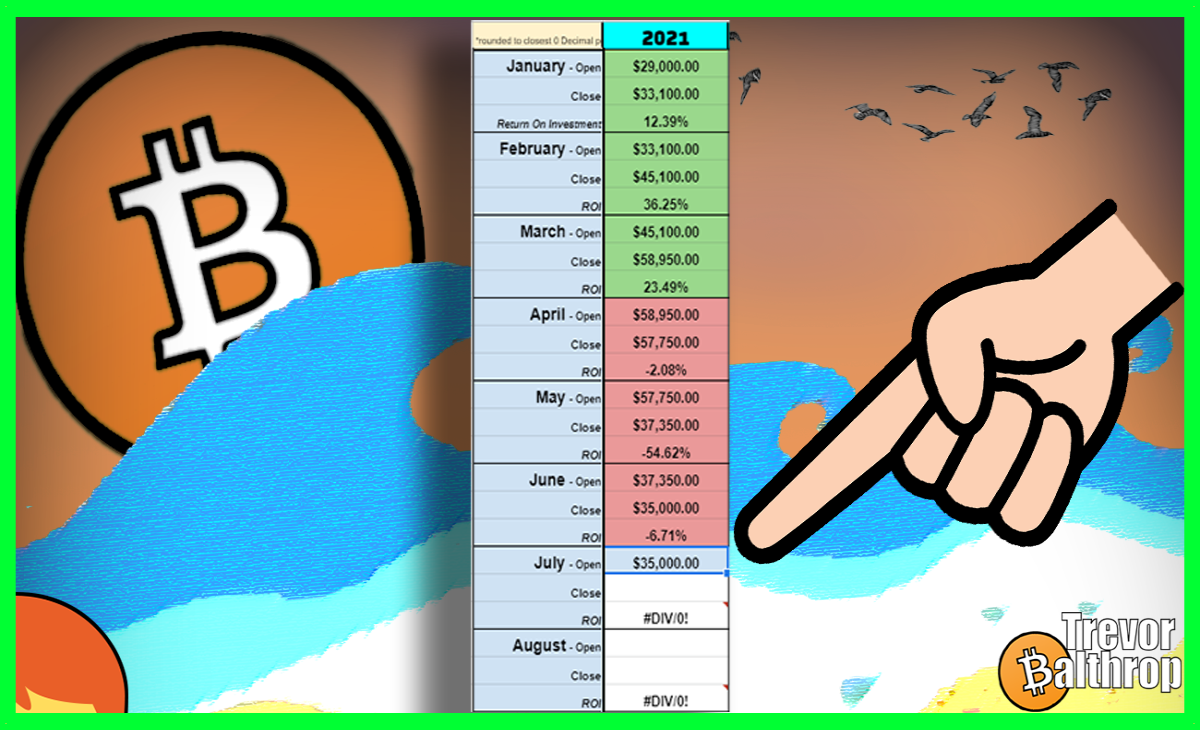
Now that we got that out of the way, let's check out this month's chart to see what we can gather from everything going on right now.
July 1st of 2021!
The official close is upon us with June closing and July opening at $35,000.
This spooked me out a little too because I actually wrote in $35,000 exactly as a prediction several weeks ago.
Definitely a lucky guess!
I was also predicting that we would close below our opening price this month marking yet another Red month.
Usually, I can guess the color so I was happy to see that prediction come true also.
Look at this though...
We have now had 3 months of Red...
We could very well have 4 months of Red, so please do not rule out that possibility.
Getting a "fourth month of Red" in July would actually increase the chances of the following month thereafter becoming Green in August. 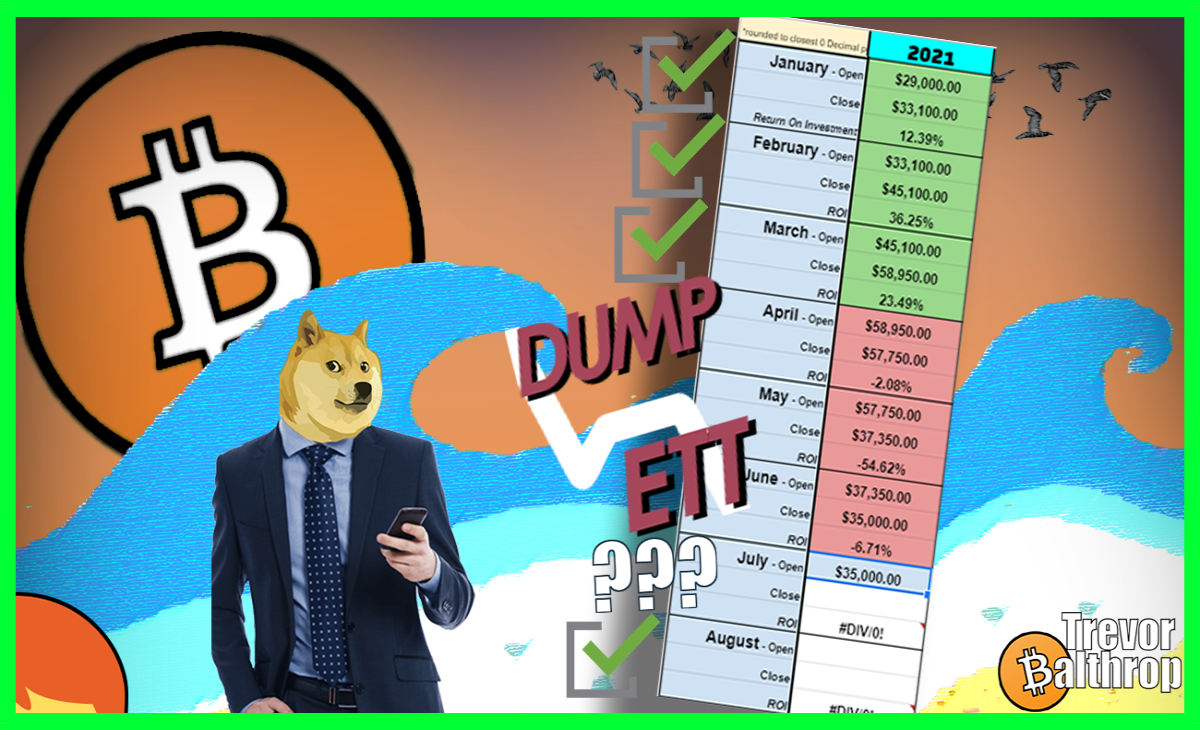
I know it's extremely frustrating thinking about the possibility of another bloody month from hell in July.
However!
It's my job to prepare you for anything!
This is, however, potentially a bottom.
Whales are going to be using all the reserves they can possibly spare to buy between now and then.
We are still in a Bull Market on the Weekly and now Daily timeframe.
More Bullish indicators and signals are coming.
All the big-mouth manipulators in the markets have quieted down.
And last but not least!
We have had THREE months in the Red here on the Bitcoin Monthly Historical Chart.
When I try to take as much as I can into consideration here.
I can't help but think that July is going to flip Green.
For it to flip green we need to close July and open August above $35k. 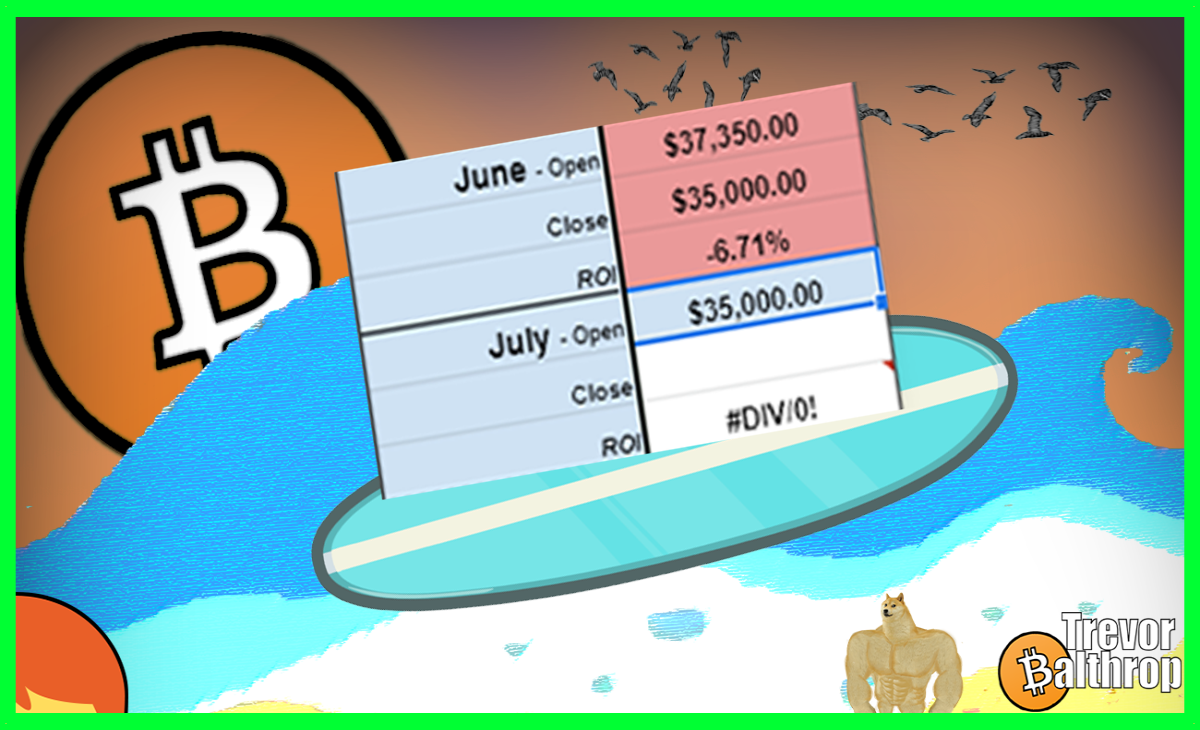
Doing this would also keep Bitcoin in the Bull Market back towards the goal of $100k.
The sentiment and technicals are all pointing to a break above $40k could be coming here very soon.
This would most likely occur sometime before we hit the open in August at the end of the month.
A break above $40k would confirm many different signals we have been starting to see shape up.
Going above $40k will no doubt flip Institutional Investors and major players Bullish again!
A buying frenzy followed by Retail users flowing back in will easily put us back into more Bullish territory.
With June closing Red on Bitcoin 3 months in a row like this?
I think we are in for another 3 months of Green before this Bull Market starts to fizzle out.
We shall see!
This is Trevor's signature 🦰
and article!
Thank you for reading!
Check out these helpful nuggets 👇
The world's 1st Bitcoin Credit Card?
Yes, please!
Use the link below to sign-up, join the waitlist, & earn up to $250 in BTC for using my Blockfi referral 😎
Referral Code = b2db60a1
Referral Link = https://blockfi.mxuy67.net/trevor
Bitcoin Credit Card Waitlist = https://blockfi.com/credit-card-waitlist/?r=n80UW


