
Welcome to September 2020 hodlers!
(source: https://twitter.com/TrevorBalthrop/status/1300873620026056706?s=20 )
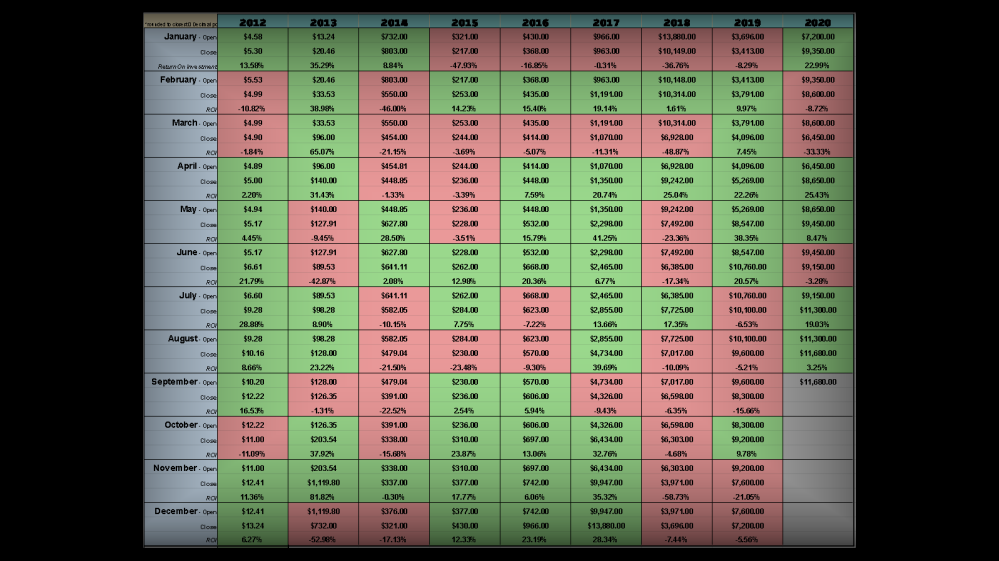
The Bitcoin Monthly Historical Chart is now updated
It may look slightly different this month and much easier on the eyes.
This because I have finally been able to recreate the chart from scratch in a spreadsheet for safekeeping.
The chart originated from a 2017 post on Twitter by a user who no longer seems to be active.
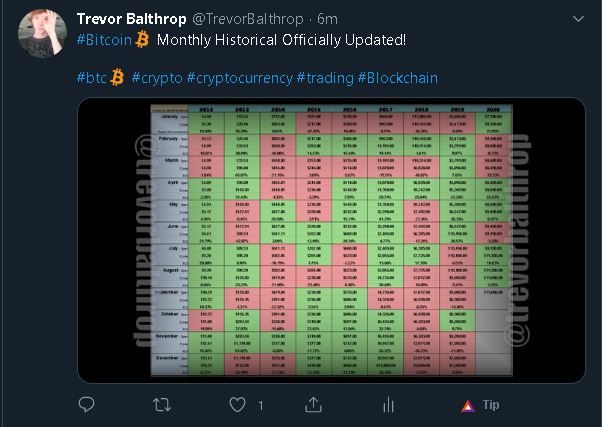
(source: https://twitter.com/TrevorBalthrop/status/1300873620026056706?s=20 )
Late last year, it felt important to revive this chart from the grave and share with others who find it insightful.
It is easy to get lost when looking at bar graphs and line graphs all day.
This chart's purpose is to take a step-back from what we traditionally look at to gain better insight.

Bitcoin's Historical Monthly Chart looks at a lot of things for us.
The most important of those things is a historical pattern!
Another important piece of information that it shows is the rate of change or ROI hit for each month.
For each year since 2012 this chart maps out only the Open and Close prices of Bitcoin leading all the way up to current days.

Some have noticed that trading on this chart alone would actually net positive gains more often than not.
Green squares represent months when Bitcoin's price closes above what it opened at.
Red squares represent months when Bitcoin's price closes below what it opened at.
The squares don't necessarily mean each month was good or bad since it literally only tracks the monthly Open and Close.
However!
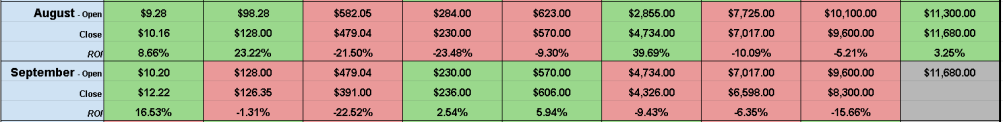
The chart seen here shows that we have now officially finished the month of August.
We are now beginning the month of September with an opening price of about $11,680.00 USD.
On August 1st we had an opening of $11,300.00 USD.
On August 31st we closed at $11,680.00 USD.
Which means, if that was traded we would have bought at $11.3k on open then waited to sell at close for $11.6k.

Not a bad profit at all!
But as we can see today, bitcoin didn't stop there and we have now reached what could potentially be the high for this month.
At about $12,045.25 USD we have hit a high and although it may be too early to call if this is the top or not.
It is highly recommended Bitcoiners pay very close attention especially with Gold possibly topping out within the last 24 hours.
August was a wild month if you missed it but if you look at this chart alone that could be difficult to see.
That's because the High for the month of August was almost $12,400 USD.
The Low for the month was a cool $11,000 that happened through the first few days of August.

Selling at around $11.8k or above last month would have been a total bargain!
In fact, there was a combined total of about 485 hours at which someone could have sold at a price of $11,800.00 or more.
That's a little of 20 days!
So for the most part August was an amazing month but lately it seems like people are feeling uncertainty.
Will we hike up to $13k or are we ready for those inevitable retest?
Regret from not selling during those 20 days has probably set in hard for those that missed out.
Those that missed out still have that opportunity now of course but there is always that possibility we see $13k soon.

No matter your position is right now just remember this!
In the weeks to come there will still be plenty of opportunities to both buy and sell.
One month is a long time and September is gearing up for some interesting action already.
Even if we moon to $13k we would still need to see a retrace back down of some kind.
Especially considering the fact that Volume still continues to go in a downtrend while Bitcoin's price creeps upwards.
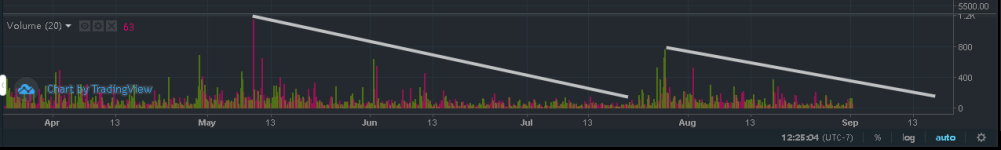
Volume is extremely important to pay attention to as it will always give us better insight into what could be happening very soon.
During the last few spikes of volume we saw prices jack themselves up to what they are at now.
The next spike in Volume is a lot less likely to be Green based on what I am seeing and we are almost overdue.
There is of course always the possibility that the next volume spike puts us up to $13k or more so don't rule it out completely!
As for me, I'm 100% out of all short, mid, and long positions.

Why Trevor?
Well for starters I already made sure to lock in my profits at around $11.7k USD and decided to play this market modestly.
Even though I could have sold at $12k USD today and locked in even further profits.
The smartest thing you can ever do for yourself is to quit while your ahead even if it is at least temporary.
As daily trader I would much rather run the risk of missing out on gains than see those gains go away out of nowehere.
And believe you-me they will!

Now because I am completely out at the moment I am waiting for a few things to happen.
The price of Bitcoin may have already hit the low for September this month and we could see Bitcoin close on September 31st higher than $11,680.00 USD.
If that were truly the case we will easily see Bitcoin hit $20k by as soon as Halloween.
How likely is that to happen though?
Well, based on this historical chart we got here, TA, and Sentiment, the likelihood of that happening is pretty damn slim now.
September will most likely see something lower than $11,680.00 even if we knock on $13k's door at some point.

Even more likely, it seems as though September is going to close in the Red rather than in the Green.
If that ends up being the case, those of us like me that sold at $11.7k will be happy Bitcoin campers indeed!
Retracing Bitcoin's price will see anywhere from a 7% to 40% spike downwards.
That's a wide range too and even at 7% there would likely a lot of people that get screwed in the short-term when that occurs.
I for one do not want to be one of those people so the wait continues!
A 7% decrease from a top of $13k would sit us back at around $12k which is what we are at now.
If we do decide to bottom out at $12k this month then heck, I'll definitely be buying that 7% dip.

A 40% dip from $13k would be $7.8k which would be an insanely huge sell off to piss off the masses.
With major players involved right now more so then every, price manipulation to those levels should not be ruled out.
In my honest opinion though, a drop that far is out of the works for now.
If we see any kind of drop from $13k or even $12k we are most likely going to end up around $9500 to $10,500 USD per Bitcoin.
Which would be a dip of about 20% or 25% in the near term.
Whether that's one massive dip or several.
Bonus Info!
After recreating this chart from scratch it inspired me to expand it more with additional information that I would like to start providing now.
For now I will share what I have completed but I plan to update some of the information on a weekly basis to share with others here.
Starting next week be on the look out for my article titled "Weekly Thots on Bitcoin" where I will share those updates as well as other news!
All-Time Return on Investment

These totals here show the All-Time ROI when we total up all months.
The same can be said for the 2020 ROI and so far so good at
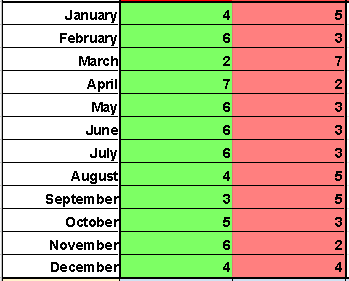
Green Months vs. Red Months
![]()
This one is pretty self-explanatory but this helps us visualize how months perform compared to each other.
And if that isn't enough to look at well then here is one last thing that might peak your interest!

Week 35 and 36 Historical Chart

This is something new that I would like to contribute to every week.
Taking some inspiration from the Monthly Historical this chart here is the same thing except for Weekly numbers!
The purpose of the Weekly chart is to break down Bitcoin into more specific price points.
If we can trade on the Monthly Historical Chart we should also be able to trade on the Weekly Chart as well.
Before we do that though, it is important we know how things are going so we don't buy during a week Bitcoin tops out.

To give us some room to work with I have back dated previous weeks to give us that insight starting this month.
Week 36 we have an open of $11,680.00 USD and we have not closed yet so the price remains at $1 until it can be changed.
Until broken, we can assume the low for this week is also $11,680.00 USD
So far a high of $12,045.00 USD is the price to beat and looks to be like an important resistance line at this time.

Last week we opened at $11,679.00 USD and ended up closing measly $1 above putting the week in Neutral territory.
The high for Week 35 ended up being $11,807.00 USD and the low $11,680.00 USD.
That's a 5.56% difference between the low and high for Week 35 which could have very easily been traded for some profit.
As for Week 36 we are starting out high and strong!
I can't help but think the price will end below what it opened at.
Of course I could be wrong so next week when this is updated and posted for us to observe next week.
We will know better by then how the future of Bitcoin is going to play out.
Until then, thank you for enjoying this article and good luck out there in the Crypto World!
Thank you for reading!
https://www.trevorbalthrop.com
Use my referral link https://platinum.crypto.com/r/2eweb7tamb to sign up for Crypto.com and we both get $50 USD 🙂
Follow on Twitter if you dare!
@TrevorBalthrop
https://www.twitter.com/trevorbalthrop


