
What market phase are we entering into has been the introductory question for our last appointments.
Welcome to Surfing the Market, we are already at our 13th appointment and I hope that with these easy tech analysis we have helped you and we can help you further.
Let’s start from our usual weekly perspective

WEEKLY CHART
The last week the Doji has been confirmed, showing in the current candle a continuation of the bull trend. During the USA inflation data release, 24500$ level has been temporarily broken, but the price has been bounced back under that price. I still see bullish indications and today I took a small long position thanks also to the indicator I am developing with my team.
At the moment, the Dollar Currency Index is still showing weekness (again), but it’s confirming current support.

Screenshot on a D-TimeFrame of the Dollar Currency Index
Showing that Dollar strength is decreasing, indicating a potential further increase into the listed assets. That is confirmed also from Gold that has recovered the prices before the last financial news (1800$/OZ area)
Do you know why my target for trading is gaining portions of BTC to be higher than exactly 0.003 BTC? Give your answer here in the comments.
Here is the operation I have done today on a very small timeframe just with the use of the new indicator we have been developing for a commercial partner.

Green and Red Arrows are the signals used for Buy and Sell orders of the position here underneath.

We also got ideas about exit strategies and we will have a tech call Sunday evening, because money never sleep!
What do I expect from a daily perspective?
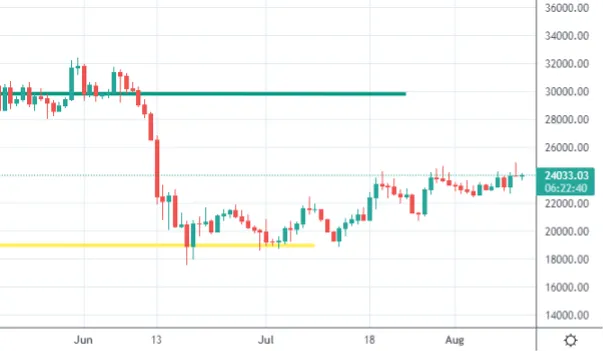
DAILY CHART
A new maximum, in the spike from yesterday, broke the current resistance level and the price can now potentially find less resistance to move upwards thanks to the Order Book temporary depleting.
DAILY CHART
Here is a daily chart, where the usual continuous red and blue lines are still clearly visible, plus the 200MA, on daily basis.
Price has geometrically reacted to the upper level of the Ichimoku Cloud, that I previously pointed as a high probability resistance. We are getting closer to the 200MA

DAILY CHART
Stochastic is ingowing towards the overbought area, meaning that a potential inversion may be seen soon, especially after another breakout of the 25k$ level.
What to observe particularly?
Trend is confirmed bullish and breaking the upper horizontal level of the Cloud is my next target (25100$ with the 25500$ of the previous spike), like the last week. The following area may be the range between 29000$ and 29600$, identified from another small horizontal level from the Ichimoku Clouds and the continuous green line.
Let me know what you think about this new weekly appointment, and what indicators you would like to be taken into consideration more (or even explained).
Stay tuned and be sure to follow to get noticed when my contents come out.
Promotional suggestion
One more thing: if you really do not care of technical analysis or you do not like spending time onto the markets, make sure to give a look to the Zignaly platform, an Official Binance Broker Partner with huge volumes under management. They offer great services of Profit Sharing Trading, where you copy other Professional traders, sharing the profit with them! Make sure to give a look!
If you are interested in getting noticed in advanced on the release of our partner’s indicators, leave a comment here so we understand if there is some interest!
None of what I write can represent a financial advice in any form. So Do your own research before taking any kind of action.






