
What market phase are we really entering into?
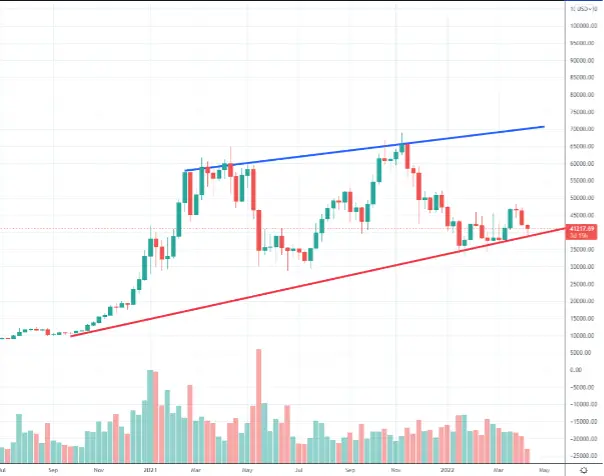
Onto the weekly chart, we are still in a rising structure, with a lower limit onto the red line and an upper limit onto the blue line.
Anyway, we can see that the bounce onto the red line has tried two times an upward movement that has been rejected twice.
What do I expect from a daily perspective?
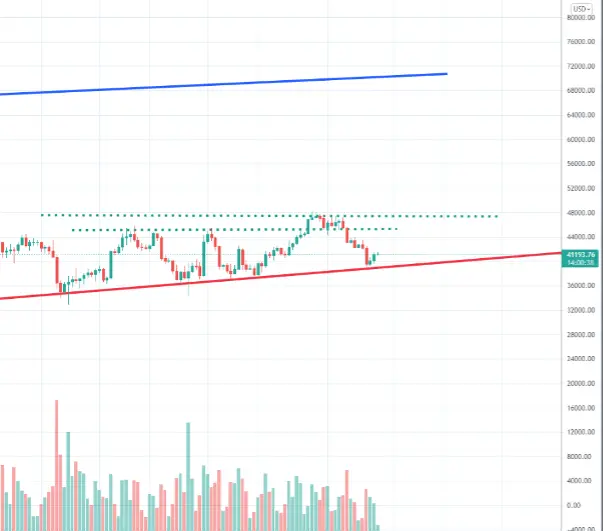
Here is a daily chart, where the continuous red and blue lines are still clearly visible.
The two dotted green lines represent the local upper limit that Bitcoin will need to break up to consolidate and confirm it’s eventual new upward trend.
What to observe particularly?
I see the 38k$ as a key level that once broken may open lower scenarios, like 33k$ first and 28k$ then.
On a daily perspective anyway, the Stochastic is in a deep oversold, increasing chances for an upper trend for Bitcoin.
Ichimoku Clouds are also entering a “bigger cloud area” meaning that in the next days, the support area will be stronger and more relevant for a potential bounce.
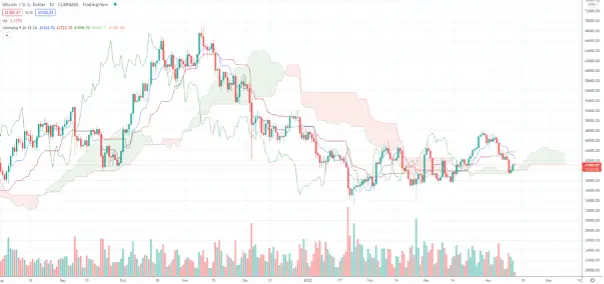
From the above chart you can see that in a few days, the support will become stronger than the actual phase.
I am not saying that I am bullish but as of now, if the 38k$ will no be broken, the probability of a rising trend will be higher rather than a lower trend.
I am thinking to create a weekly content about Bitcoin market scenario.
I would love to read what think on it, and what indicators you would like to be taken into consideration more (or even explained).
Stay tuned and be sure to follow to get noticed when my contents come out.






