
What Market Phase are we entering into has been the introductory question for our last appointments. Are we going to listen to the Bulls or the Bears? Are we going to see a Bull Market or a Bear Market?
Welcome to Surfing the Market, we are already at our 21th appointment and I hope that with these easy tech analysis we have helped you in some forms, even just to evaluate different market perspectives.
Let’s start from our usual weekly perspective
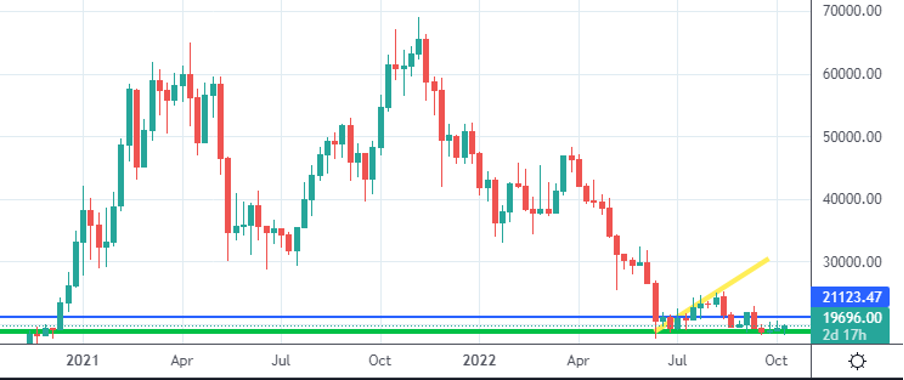
Weekly Chart — Source: Tradingview
Price has tested one more time the price area of the Green Line that is still acting as a support.
This is the most recurrent phrase in the last weeks into my weekly Market screening. Green support line has been momentarily broken during the announcements of the USA Inflation Data reaching 8.2%.
Anyway, after the first initial fear of the markets when the price of Bitcoin dropped from the 19100$ level down to 18200$.
Once some Shorters and some Stop-Loss have been removed and executed, market has started to bump again in a perfect Bear Trap, with a consequent Bull Trap that is seen currently while I am writing. If the Bear Trap was harder to see, since you can never measure in advance the impact of such a news, the following Bull-Trap was easier to detect and making some profits. (I have sold a position in BTC at 19.627$ area, and I have put a Buy-Limit Order at 19.421$).
As said before, in my personal opinion Bitcoin price can only drop towards 15000$ if major bad news come up, like a huge electricity crisis, a mobile network crisis or a gas limitation from Russia.
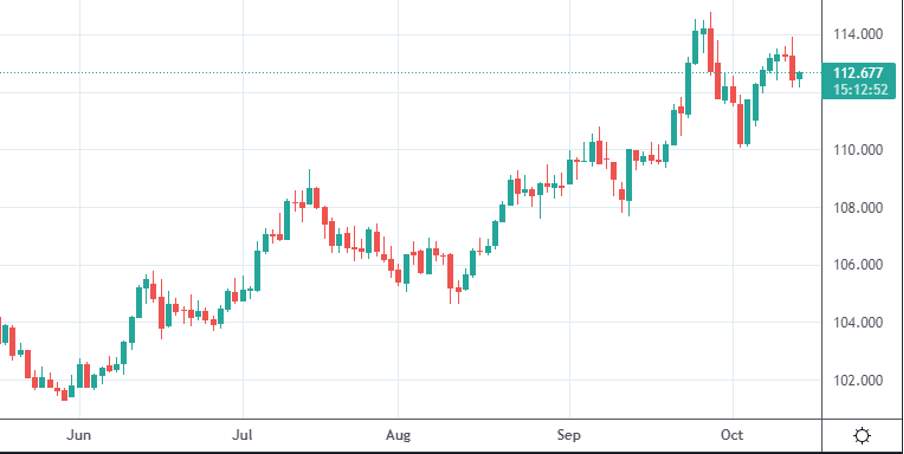
Screenshot on a D-TimeFrame of the Dollar Currency Index
Dollar Strength Index has shown some uncertainties as well, yesterday. The weakness from yesterday could be the trigger of the Bitcoin bounce-back. But now the DSI is recovering and that is why I sold a small part of BTCs, since I personally expect price contraction.
What do I expect from a daily perspective?
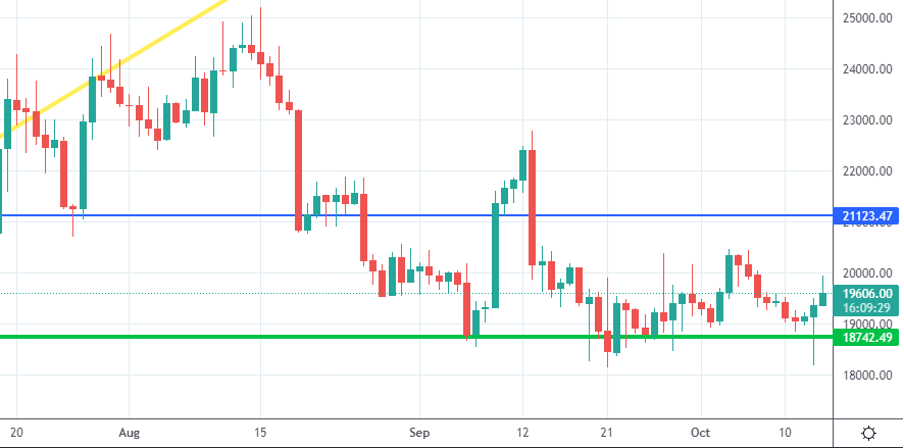
Daily Chart — Source: Tradingview
We have seen another deep movement below the green support, that has been immediately absorbed from the demand pool, making this elastic bounce.
At the moment, I am still conservatively Bullish.
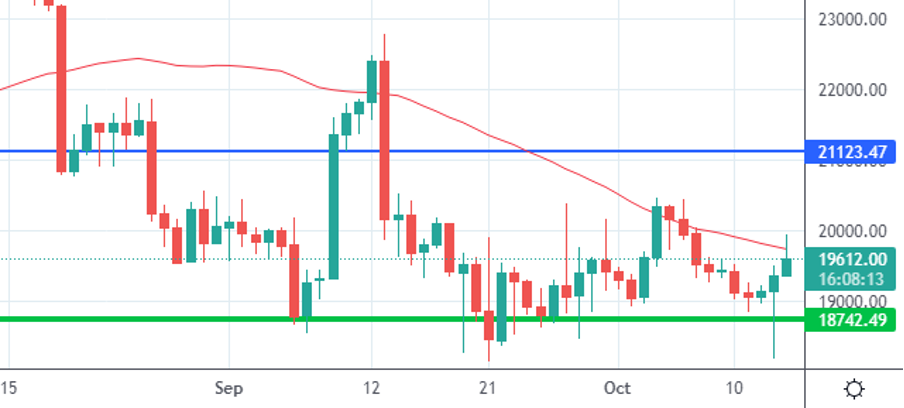
Daily Chart — Source: Tradingview
50MA on a Daily TF is acting again as a resistance rejecting the price. Gradually breaking the 50MA could be a first signal for a local-bullish trend, to reach the Blue Resistance again.
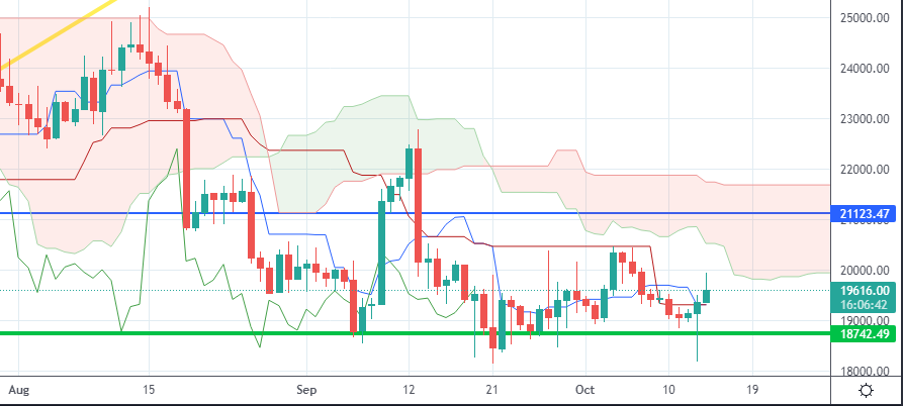
Daily Chart — Source: Tradingview
What to observe particularly?
50MA and Ichimocku Clouds can act as Resistance. I expect some small volatility to bring the price back to he level 19000$ and then a possible continuation of the local Bull-trend.
I am waiting the Blue Level breakout to see more upward movements.
Let me know what you think about this new weekly appointment, and what indicators you would like to be taken into consideration more (or even explained).
Stay tuned and be sure to follow to get noticed when my contents come out.
Promotional suggestion
One more thing: if you really do not care of technical analysis or you do not like spending time onto the markets, make sure to give a look to the Zignaly platform, an Official Binance Broker Partner with huge volumes under management. They offer great services of Profit Sharing Trading, where you copy other Professional traders, sharing the profit with them! Make sure to give a look!
If you are interested in getting noticed in advanced on the release of our partner’s indicators, leave a comment here so we understand if there is some interest!
None of what I write can represent a financial advice in any form. So Do your own research before taking any kind of action.


