![[Monkey Trade] Tranding Ideas Summary BTC/USD Dec 27](https://www.publish0x.com/img/396272.webp?action=resize&ar=1&enc=webp&inv=0&ori=1&st=1&up=1&w=1140&signature=2c7282bb5c3f5485edbada1ab4c0fb60fad9c777f38718401d92269baf586822)
!!!Attention this is not a recommendation, it is a summary of a set of ideas from tradingview It simply serves to inform you.!!!
By: ChristopherCarrollSmith 20:04 Dec 26, 2020 (Editor: Amazing stuff)
How high can Bitcoin go? Watch transaction fees
A major obstacle to widespread adoption of Bitcoin is the processing power bottleneck. Bitcoin transactions are enormously complex and require a tremendous amount of computing power. As a result, the Bitcoin network has a lot less capacity than competing electronic payment technologies. The Bitcoin network can currently process about 7 transactions per second, compared to 1,700 per second for Visa or Ripple.
This technology bottleneck makes it difficult to scale Bitcoin in a way that would make it competitive with traditional electronic payment processing. The result is that whenever capacity scaling has fallen behind adoption rates, Bitcoin users have had to deal with either long delays to complete a transaction or high fees in order to get faster service. Adoption rates and transaction throughput then fall off, and the miners have a chance to get ahead of demand in terms of building capacity. When capacity gets well ahead of transaction volume , investor interest rises, and that's when Bitcoin goes on bull runs. The cycle has seemed nicely predictable so far.
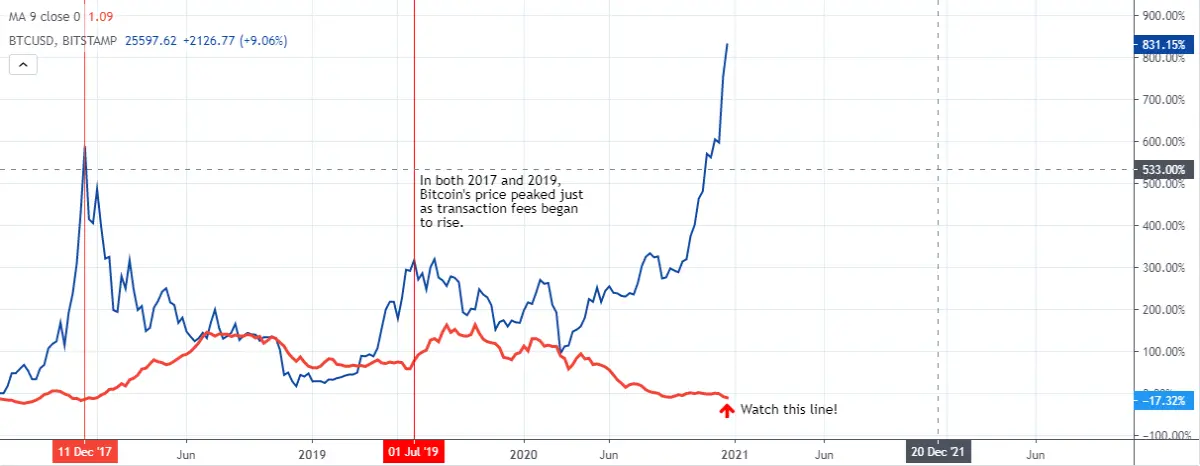
In 2017, just before Bitcoin went on a big bull run, the miners got the average transaction fee below 1% of total transaction volume . That's very competitive, considering Visa's average transaction fee is over 2%. Traders responded to the low fees by investing in Bitcoin . Unfortunately, the low transaction fees were partly the result of low volume on the Bitcoin network. When investor interest rose, the network eventually hit a transaction volume bottleneck at which fees began to rise. In the first half of 2018, Bitcoin's price steadily fell as average transaction fee steadily rose toward the prohibitive price of 3%.
The Bitcoin bull run in 2019 followed the same pattern. Fees fell to 2% of volume , enabling a modest gain in Bitcoin's price as investors returned to the asset. The run peaked just as the network again hit its bottleneck and fees began to rise back toward 3%.
The current price run illustrates how much progress has been made on network capacity and transaction cost. Although Bitcoin prices have surged to record levels, fees have remained low as a percentage of total volume , in the neighborhood of 1%. I suspect, however, that the problem has not been completely solved. At some level of transaction volume , we will once again hit a processing power bottleneck. At that point, transaction fees should again start to rise and Bitcoin's price should again peak.
The beauty of this pattern is that it's so logical. There are basic principles of economic theory driving this thing. Bitcoin transaction fees are set by supply and demand . When you exhaust the supply of miner processing power, fees rise. And demand for Bitcoin is partly a function of the price of usage, so as transaction fees rise, they suppress investor demand and Bitcoin's price.
By:kyer 03:55 Dec 26, 2020
Bitcoin Dominance (BTC.D) Approaching ATH
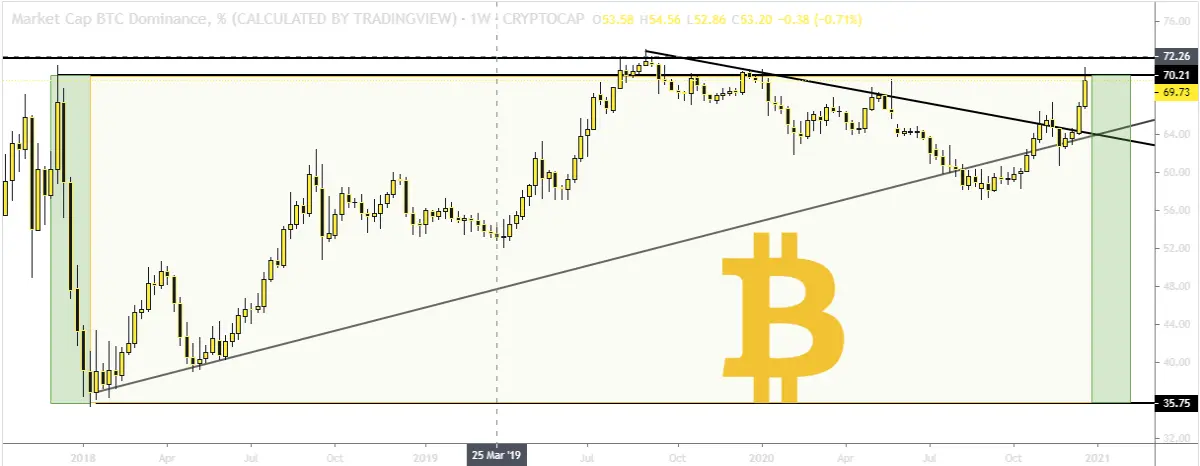
Looking at the 1W timeframe of the Bitcoin Dominance Ratio ( BTC .D) is slowly re-approaching it's previous all time high. This means that right now BItcoin's market cap is about 70% of the entire crypto market cap and still rising.
Since the altcoin season at the end of 2017, the Dominance ratio has been gaining and doubled from 35% to 70%. From here on the next weekly candle, BTC is going to retouch the top mkt. cap dominance at 72.04%.
Another option for the Dominance is that this weekly candle (just like the move up to 72%) closes below the level and doesn't gain it as support. At the start of the altcoin season we saw the exact same candle pattern on the weekly where it 1st touch rejected off of the 70% dominance level before proceeding to fall in the following weeks.
Right now, that same exact pattern could play out. We are now 3 years exactly from the previous altcoin season and have seen many coins been shaekn out as well as 10x and 100x growth on more-known altcoin projects. It's only a matter of time before the dominance crashes again for another altcoin season and i'm going to continue posting this chart giving updates until it happens.
In 2017 also to take note of, Litecoin (LTC) lead the altcoin season and right now it seems to be outperforming the market by a lot after breaking out of a 2-year downtrend.
History doesn't repeat itself, but it often rhymes.
____________________________________________________________________________________________________________________________________________________________________
Daily Crypto Calendar, Dec 27th
- Amon (AMN)
Fim da arrecadação de fundos do cartão
Fim da arrecadação de fundos para Amon Card Limited - Carteira Global e Cartão de Débito para Crypto & Fiat aprovado pela UnionPay Internati...
- Moeda Loyalty Points (MDA)
Comunidade turca AMA
"Estamos felizes por anunciar #AMA With #Moeda $ MDA em 27 de dezembro (16.00 UTC) (Turquia: Pazar 19.00)"
____________________________________________________________________________________________________________________________________________________________________
➡️Real-time quotes; free graphics and expert trade ideas. Only at TradingView
➡️ Solve your faucets automatically with faucetcollector
➡️ Advertise on your blogger now with a-ads and moonads
➡️ Invest and Trade on Binance and get a % of fees back
➡️Earn some #sats with the best faucet of the moment faucetpay
➡️ Earn for write with publish0x
➡️Buy games on all platforms in half with Gamivo





