
The trend is the direction of the market, ETF or stock that we are observing.
There is a famous saying on the stock market that says "the trend is our friend", referring to the fact that one must operate in favor of the trend, which must be determined in order to make a good decision.
The trend can be bullish, bearish or lateral (there is no trend in the latter).
It is always best to choose an asset with a clear trend, ruling out the side.
How to know what is the trend of the asset that we are observing?
Prices are not moving in a straight line, but rather zigzagging.
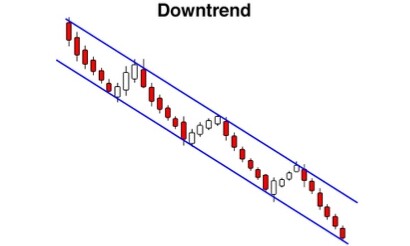
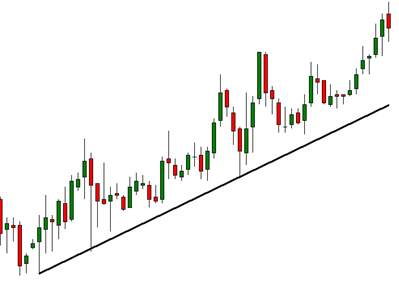
That is why, one way to determine it is by joining the maximum and minimum points, which are called trend lines.
We show some graphic examples with the TradingView tool:
Downtrend: downward succession of prices
Bullish trend: succession of rising prices
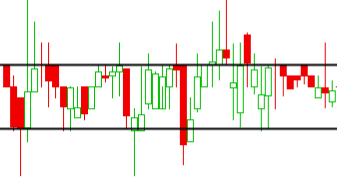
Lateral trend: undefined, the maximum and minimum points have a ceiling and floor.
It is usually shaped like a rectangle.
In general, the main trend of the asset is usually viewed in monthly, weekly or daily terms.
But within these there are secondary trends, due to the simple zigzagging of prices, so that within a major upward trend, there may be a downward micro trend.
It depends on what you want to use according to the temporality with which you work, that is to say that in practice the analysis you make of the trends will correspond to the temporal space in which you are investing.
These micro trends or secondary trends may occur due to news or general market conditions or some economic event.
Regarding trend lines, it is important to emphasize that the first two points (either maximum or minimum) allow to draw a line, but a third one is required for the line to be confirmed, and therefore the trend.


