
Support: it is an area of the chart that the price stops when it drops.
That is, stop lowering the price to that level.
Resistance: it is an area of the graph that the price stops rising.
That is, it stops raising the price to that level.
The supports happen when the market in general or the investors consider that the price of the asset is very low, then the price at that level rises as they begin to buy.
On the contrary, resistances happen when the market considers it to be a very high price for the asset and investors start selling, causing a drop in prices.
These areas are of vital importance for all investors, since the supports and resistances are used to mark entry points, either for buying or selling.
Observing a Japanese candlestick chart, the resistance and support zones are plotted as follows:
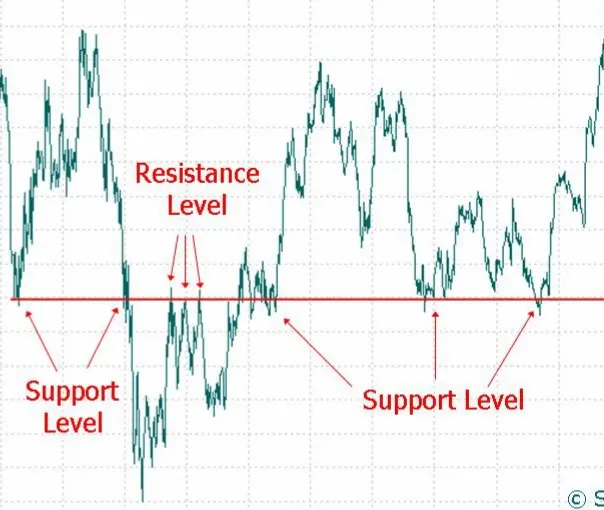
When we see that the price reaches an area where it stops and is unable to overcome it, we draw a horizontal line.
To establish this, as well as with trends, you need 2 coincidence points and one confirmation, that is, at least 3 points that show that the price stopped on a support or could not overcome a resistance.
It is common for a support to become resistance at a given moment, or vice versa, that is, when a support breaks, it becomes resistance, when a resistance breaks, it becomes support.
When the trend is bullish, resistances become supports.
From being a downtrend, supports become resistance.
The supports and resistances of graphs with higher temporalities are more relevant, they are usually important.
For example, if we are analyzing a daily chart, and we see a resistance or weekly support, those areas will be more difficult to overcome, they are important areas for investment decision making.
Why must supports and resistances be identified?
Because they are the basis of trading, since most price-based strategies need to correctly identify the most relevant supports and resistances.
They are used to detect probabilities, as if the price in an area is likely to change direction;
and to place stops loss, since this allows us to shorten the loss putting it in a limited risk that we are assuming.
If our trade goes higher, the stop will be below the support.
If we go down, the stop will be above resistance.






