
The double ceiling is a trend change formation, which occurs when there is an uptrend and reaches a point where the maximum does not exceed the previous maximum, thus causing resistance in that area.
This is a sign that a change in trend may occur, from bullish to bearish.
The second time the price reaches the area, we must see what can happen: if it breaks resistance and overcomes it;
or if it falls back as it did the first time.
We must wait for the Japanese candle to finish forming (regardless of the timing in which you are working).
We have to consider:
a) If the candle crosses the resistance zone, but closes below the resistance, we can have an indication of a false break.
This gives us a signal to enter the downside.
If the sail crosses resistance with a large body, we can consider that the area has been overcome.
Ideally, you should expect a pullback to the level that was previously resistance, as this level generally becomes support to continue the rise.
b) If the price fell previously and retests the resistance zone, it will most likely fall again.
He is one of the best known figures and they happen often.
It has high reliability but it does not always work and you have to analyze the probabilities very well.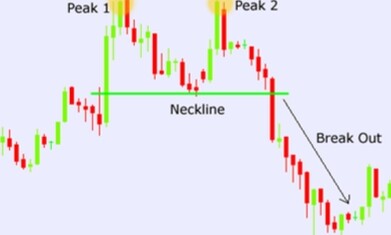
In reality it is so.
In the example, it looks like it is coming from an uptrend, it is double-topped and cannot break it, causing a drop in prices.
It does not have to be perfect, like none of the figures.
That is why we sometimes doubt whether or not he is the figure we are thinking about.
Regarding volume when analyzing a double ceiling, the first peak of the double ceiling is a normal maximum.
Ideally, the volume will rise as the price hits a new high, and decrease as it pulls back.
We must observe if the second maximum is achieved with a lower volume than the previous one to give us indications, and then that the volume increases in the descent of the second maximum, signaling the downward trend.
Remember that to operate a double roof we need, as seen in the example:
A previous bullish trend
First roof
At this time, nothing should suggest that the trend is in danger, since it is a normal rise.
Valley
After the first maximum occurs, a decline will occur, with a decrease in volume.
Second roof
It should be done with a low volume, which will increase in the fall, so that the volume is already giving us signs of a downward trend.
Although the ideal is that the maximums are at the same height, different situations can occur, such as the second ceiling being higher or lower than the first.
Confirmation of a double roof
A double roof is not confirmed until the neck line has not been broken.
This neckline is the support of the "M" that has been formed.
The double roof is also known as the letter M. In the following image you can see the double roof that we had before, but now the neck line or the base of the M is shown, where it really confirms the downtrend.
This is the best time to enter a short selling strategy or puts contracts (we will see it in financial instruments and strategies).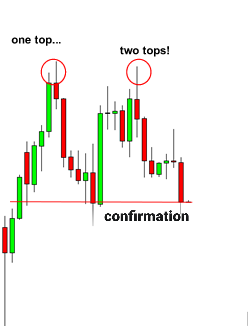
The “theoretical” movement or the expected price movement is obtained by measuring the height of the pattern, and transferring that height to the break.
That is, the height between the double roof line and the neck line.
Until there it could fall, and therefore take the benefits.


