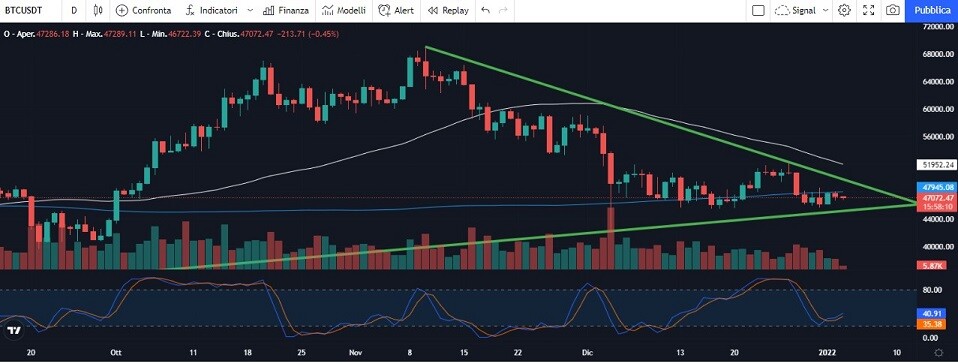
Bitcoin managed to bounce back above 48,500 on Friday. However, he could not sustain the move and fell steeply as the year ended. The main cryptocurrency has dropped as low as 45,778. Much of the decline was made up for over the weekend as BTC rallied back towards 48k. However, he was unable to regain levels above 48k and spent the rest of the weekend tracking sideways, between 46,700 and 47,955. The range seen so far today has been covered from 47475 to 46738. So the current price is now back below its 200-day moving average again. This is now in place of 47945. Meanwhile, the 50-day moving average (white line) is still falling quite steeply towards the 200-day moving average. This is now at 51952.
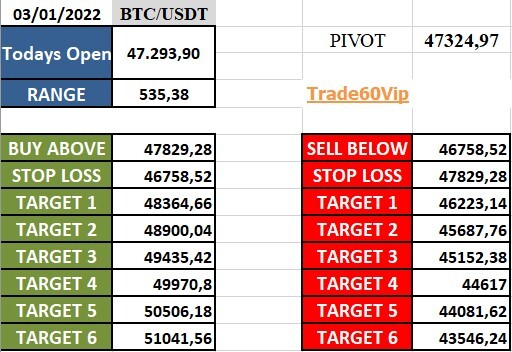
As usual I am attaching levels for intraday trading on BTCUSD.
How to interpret the levels?
I use them like this, I use a time frame of 30 minutes and with a close of the candle above the BUY ABOVE price I go long with the relative targets. And the indicated stop loss. I consider the first three targets the most important ones.
A short opening occurs with a price below SELL BELOW with the relative targets and the stop loss.
For further analysis and trading ideas follow me on Patreon, you will also have a dedicated VIP telegram channel (in Italian, to be translated) https://www.patreon.com/mariocarotenuto You will find a pdf book on Japanese candles, a Pivot CPR Camarilla excel file and instructions.
Log in to Publish0x:
https://www.publish0x.com/?a=oQeZ4DR6bp
Open an account with Kucoin use my code: https://www.kucoin.com/ucenter/signup?rcode=rJEUMUV
Open a Coinbase account to get bonuses 10$
https://www.coinbase.com/join/carote_7
This article does not contain investment advice. Every investment and trading move carries a risk, readers should conduct their own research when making a decision.
THE OPINIONS EXPRESSED BY THE AUTHOR ARE FOR INFORMATION PURPOSES ONLY AND DO NOT CONSTITUTE FINANCIAL, INVESTMENT OR OTHER ADVICE.
Graphic: tradingview.com