
Let's begin by sketching current channels (in yellow) and hypothetical channels (in green, purple, red, and gray) on the chart below:
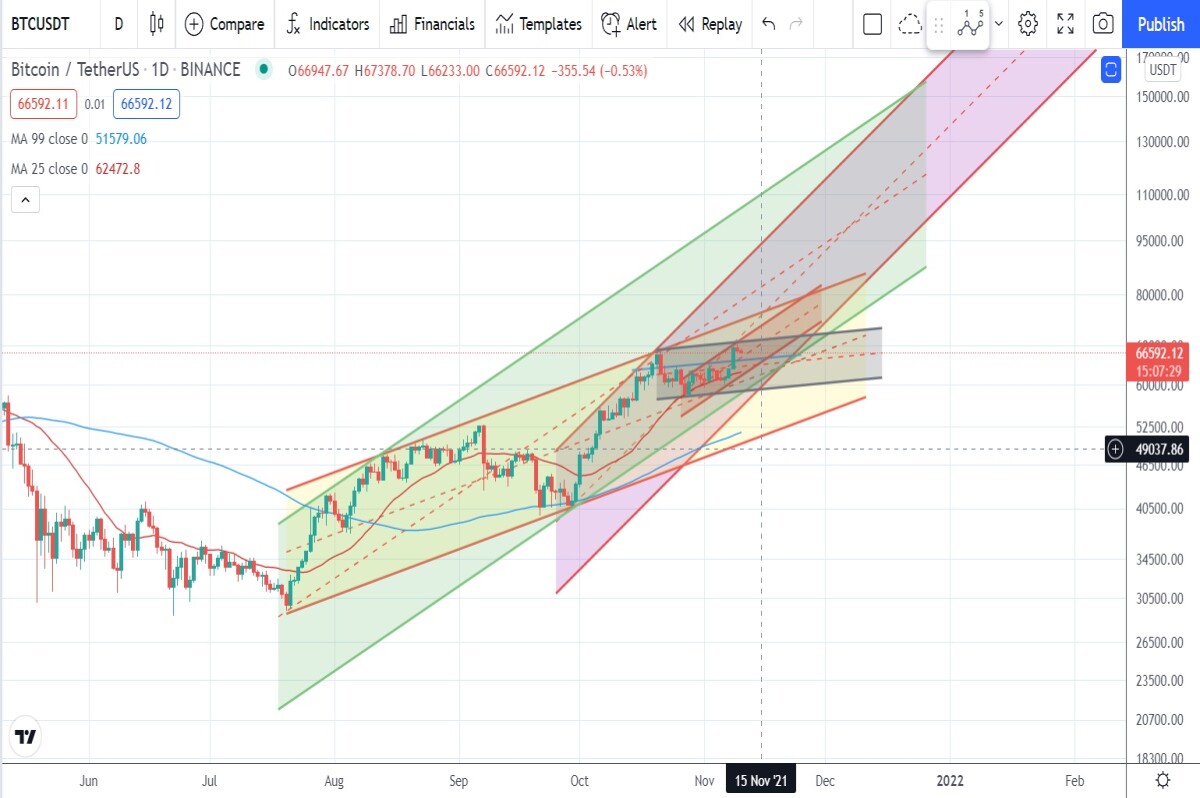
After that, we'll assess the possibility of future market values and, lastly, we'll determine an entry point.
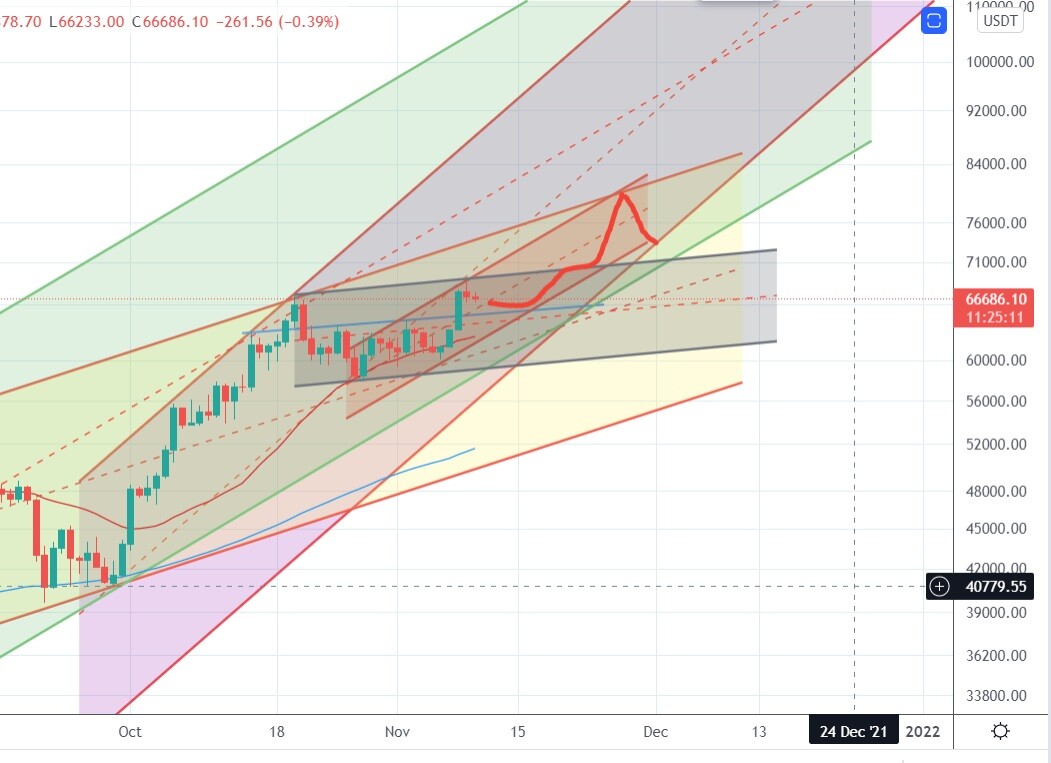
The red channel indicates that the price may drop to $65,768 and then rise to $74,474, then it will reach the cross point of the red and yellow channels, which is 79420. (see the second figure).
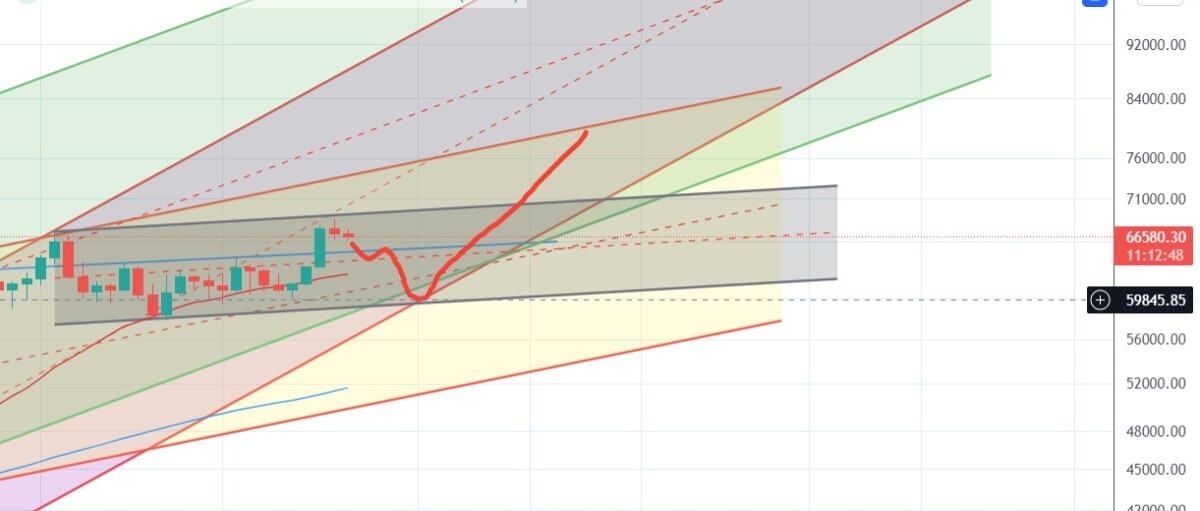
According to gray channel analysis, the market will dip to $59,845 before climbing to $78,943 on November 15th, after that, the long run will begin (Please see the next figure).
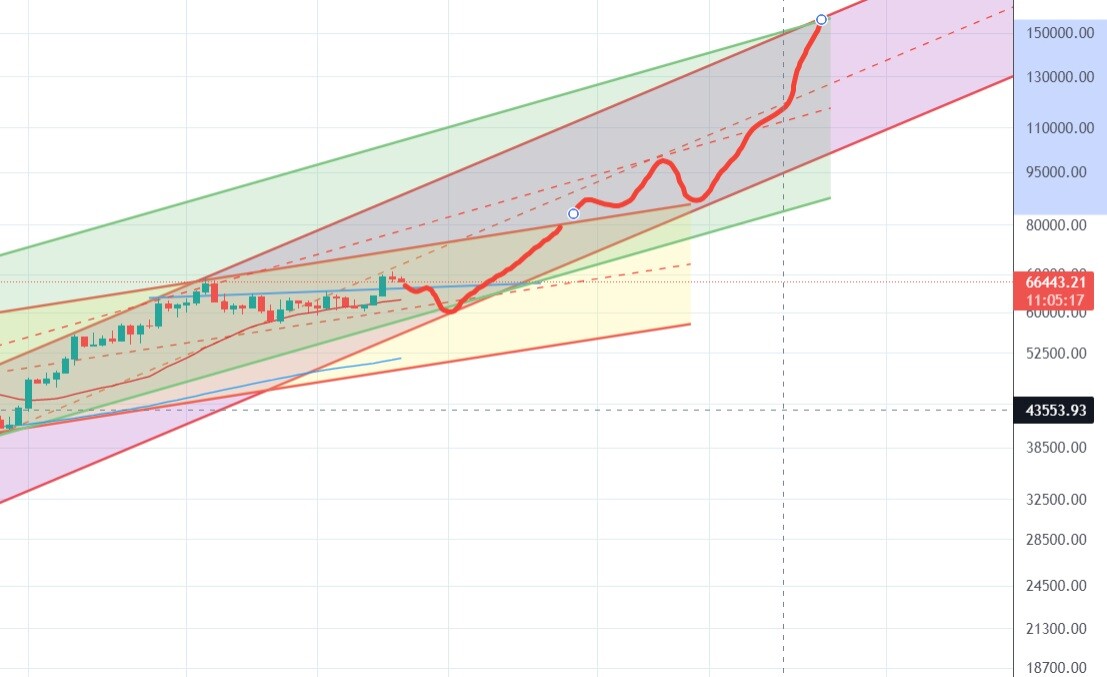
In the other condition, which we consider the green, purple, and yellow channels, we find that the market should drop to the cross point of the purple and green channels on November 15th, which is approximately $59,845; and then resume its upward trend to the top of the yellow channel, which is approximately $78,943. If the price can break above the line, it will increase to $99,537 till December 7th and 8th. Then, between December 10th and 12th, we will see a pullback to $85,815.
The last wave will go up to $155,405 until December 24th. (Please see the following figure).
According to the various conditions described above, the best rate to enter the market is around $60,000. However, the optimal tactic is to follow the dates mentioned above. For example, if the market follows the pattern of the first condition, the best strategy is to stay out and wait for the next drop. If the next drop occurs on November 15th, take your position around $60,000.
I hope we all have a prosperous New Year's celebration.


