
The Theory:
The "sotck to flow" theory indicates that the lower the issuance and provision of the cryptocurrency, to that extent, the higher the price of the currency or asset in the market. The theory is the same that predicted and was correct about the performance of the cryptocurrency, once the Halvings of 2012 and 2016 were made. And it was also correct in the 2020 halving, saying that once the sixth month had elapsed since the halving that occurred In May, that is, November 2020, bitcoin would appreciate significantly, and in addition this model estimates an even higher future price for the king of cryptocurrencies.
The model:
Stock to flow (S2F), was created by the analyst who calls himself "planB", originally published in March 2019, and its purpose is to review the relationship between the production of the supply and the current available stocks. Value calculations based on the supply of new Bitcoins entering circulation through mining, compared to the existing supply (stock).
Each issuance of Bitcoin is halved once a Halving occurs, the event is known to increase the price of assets in the following months after the reward reduction. This model was considered a very important theory in the cryptocurrency market, since the growth of Bitcoin can be scaled every time a Halving occurs, which is an event that reduces the reward to miners and that usually repeats every four years, until the year 2140.
Indicator Overview:
This model treats Bitcoin as being comparable to commodities such as gold, silver or platinum. These are known as 'store of value' commodities because they retain value over long time frames due to their relative scarcity. It is difficult to significantly increase their supply i.e. the process of searching for gold and then mining it is expensive and takes time. Bitcoin is similar because it is also scarce. In fact, it is the first-ever scarce digital object to exist. There are a limited number of coins in existence and it will take a lot of electricity and computing effort to mine the 3 million outstanding coins still to be mined, therefore the supply rate is consistently low.
Stock-to-flow ratios are used to evaluate the current stock of a commodity (total amount currently available) against the flow of new production (amount mined that specific year).
For store of value (SoV) commodities like gold, platinum, or silver, a high ratio indicates that they are mostly not consumed in industrial applications. Instead, the majority is stored as a monetary hedge, thus driving up the stock-to-flow ratio.
A higher ratio indicates that the commodity is increasingly scarce - and therefore more valuable as a store of value.
How To View The Chart:
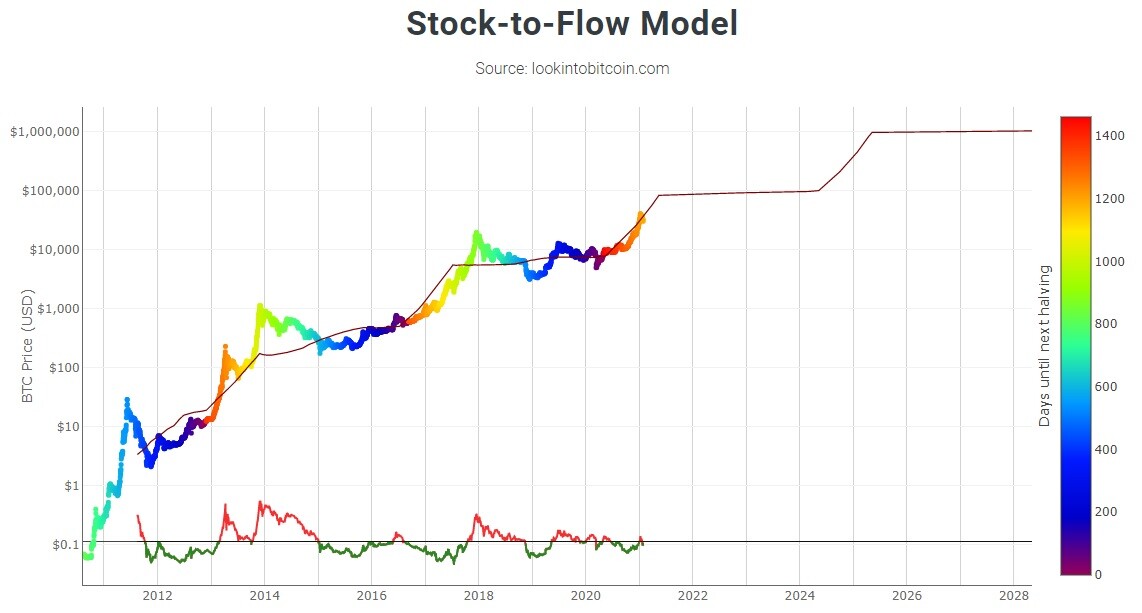
On the above chart price is overlaid on top of the stock-to-flow ratio line. We can see that price has continued to follow the stock-to-flow of Bitcoin over time. The theory, therefore, suggests that we can project where price may go by observing the projected stock-to-flow line, which can be calculated as we know the approximate mining schedule of future Bitcoin mining.
The colored dots on the price line of this chart show the number of days until the next Bitcoin halving event. This is an event where the reward for mining new blocks is halved, meaning miners receive 50% fewer bitcoins for verifying transactions. Bitcoin halvings are scheduled to occur every 210,000 blocks - roughly every four years - until the maximum supply of 21 million bitcoins has been generated by the network. That makes stock-to-flow ratio (scarcity) higher so in theory price should go up. This has held true previously in Bitcoin's history.
The stock-to-flow line on this chart incorporates a 365-day average into the model to smooth out the changes caused in the market by the halving events.
In addition to the main stock-to-flow chart, I have created a divergence chart (lower section of the chart) which shows the difference between price and stock-to-flow. When price moves above stock-to-flow (divergence line turns from green to red), thereby allowing us to easily see how price interacts with stock-to-flow through market cycles over time.
------------------------------------------------------------------------------------------------------------------------------------------------------------------------
La Teoría:
La teoría "sotck to flow" indica, que cuanto menor sea la emisión y provisión de la criptomoneda, en esa medida, mayor será el precio de la moneda o del activo en el mercado. La teoría es la misma que predijo y acertó acerca del rendimiento de la criptomoneda, una vez realizados los Halvings de 2012 y 2016. Y también acertó en el halving de 2020, al decir que una vez transcurrido el sexto mes desde el halving que se dio en mayo, es decir noviembre de 2020, bitcoin se apreciaría notablemente, y además dicho modelo estima un precio futuro aún más elevado para el rey de las criptomonedas.
El modelo:
Stock to flow (S2F), fue creado por el analista que se hace llamar "planB", se publicó en marzo del año 2019, y tiene como finalidad revisar la relación existente entre la producción de la oferta y las existencias disponibles actuales, realiza cálculos del valor basados en el suministro de nuevos Bitcoins que entran en la circulación a través de la minería, en comparación con el suministro de suministro (stock).
Cada emisión de Bitcoin se reduce a la mitad una vez que ocurre un Halving, es sabido que el evento aumenta el precio de los activos en los meses siguientes después de la reducción de la recompensa. Este modelo se considera una teoría de mucha importancia en el mercado de las criptomonedas, ya que se puede escalar el crecimiento del Bitcoin cada vez que ocurre un Halving, el cual es un evento que reduce la recompensa a los mineros y que suele repetirse cada cuatro años, hasta llegar al año 2140.
Descripción general del indicador:
Este modelo trata a Bitcoin como comparable a productos básicos como el oro, la plata o el platino. Estos se conocen como productos básicos de 'reserva de valor' porque retienen su valor durante períodos prolongados debido a su relativa escasez. Es difícil aumentar significativamente su oferta, es decir, el proceso de buscar oro y luego extraerlo es caro y lleva tiempo. Bitcoin es similar porque también es escaso. De hecho, es el primer objeto digital escaso que existe. Existe un número limitado de monedas y se necesitará mucha electricidad y esfuerzo informático para extraer los 3 millones de monedas pendientes que aún quedan por extraer, por lo que la tasa de suministro es constantemente baja.
Las relaciones de existencias a flujo se utilizan para evaluar las existencias actuales de un producto básico (cantidad total actualmente disponible) contra el flujo de nueva producción (cantidad extraída ese año específico).
Para los productos básicos de almacenamiento de valor (SoV) como el oro, el platino o la plata, una proporción alta indica que en su mayoría no se consumen en aplicaciones industriales. En cambio, la mayoría se almacena como una cobertura monetaria, lo que aumenta la relación stock / flujo.
Una proporción más alta indica que el producto es cada vez más escaso y, por lo tanto, más valioso como reserva de valor.
Cómo ver el gráfico:
En el gráfico anterior, el precio se superpone encima de la línea de relación stock-flujo. Podemos ver que el precio ha seguido siguiendo el flujo de acciones de Bitcoin a lo largo del tiempo. Por lo tanto, la teoría sugiere que podemos proyectar hacia dónde puede ir el precio observando la línea proyectada de stock a flujo, que se puede calcular a medida que conocemos el cronograma de minería aproximado de la futura minería de Bitcoin.
Los puntos de colores en la línea de precios de este gráfico muestran el número de días hasta el próximo evento de reducción a la mitad de Bitcoin (halving). Este es un evento en el que la recompensa por extraer nuevos bloques se reduce a la mitad, lo que significa que los mineros reciben un 50% menos de bitcoins por verificar transacciones. Está previsto que se produzcan reducciones a la mitad de Bitcoin cada 210.000 bloques, aproximadamente cada cuatro años, hasta que la red haya generado el suministro máximo de 21 millones de bitcoins. Eso hace que la relación existencias / flujo (escasez) sea más alta, por lo que, en teoría, el precio debería subir. Esto ha sido así anteriormente en la historia de Bitcoin.
La línea de stock a flujo en este gráfico incorpora un promedio de 365 días en el modelo para suavizar los cambios causados en el mercado por los eventos de reducción a la mitad.
Además del gráfico principal de stock a flujo, he creado un gráfico de divergencia (sección inferior del gráfico) que muestra la diferencia entre precio y stock a flujo. Cuando el precio se mueve por encima del stock-to-flow (la línea de divergencia cambia de verde a rojo), lo que nos permite ver fácilmente cómo interactúa el precio con el stock-to-flow a través de los ciclos del mercado a lo largo del tiempo.


