
How understanding simple math and human psychology can transform your trading approach.
The first time I opened a trading chart, I saw what looked like a video game for adults. Lines crisscrossed candles, indicators blinked like cockpit dashboards, and abbreviations like RSI, MACD, and EMA filled the screen like insider code.
I was captivated—and skeptical.
On YouTube, I watched someone swear by Bollinger Bands as if they were cheat codes. In another video, a self-proclaimed expert pointed to a “death cross” like it was a cosmic signal. Everyone had a favorite indicator, a secret formula, a perfect setup.
To me, it all seemed absurd. How could anyone reliably make money by staring at price charts that looked like electrocardiograms?

Forget Crystal Balls. Think Casino Odds.
The big secret nobody tells you when you start trading?
Trading isn’t about being right. It’s about managing risk when you’re wrong.
This hit me when I stopped obsessing over chart patterns and started studying the simple math behind the game. The truth is: every trade is just a bet. And like any bet, it has odds, a payout, and a cost to play.
But before we dig deeper into the math, it’s important to clear up a common misconception:
Technical indicators aren’t fortune tellers. They’re tools to help you stick to a system.
When used properly, indicators like moving averages or Bollinger Bands don’t predict the future; they help you stay consistent—giving signals to enter or exit trades based on defined rules. They become part of a disciplined process, making it easier to evaluate what works and what doesn’t over time.
The Fundamental Math of Trading
At its core, trading success boils down to a formula:
Expected Value (EV) = (Win Rate × Average Win) – (Loss Rate × Average Loss)

That’s it. That’s the game.
Here’s what those terms mean:
- Win Rate: How often your trades are profitable.
- Average Win: How much you make when you're right.
- Loss Rate: How often you lose (1 minus win rate).
- Average Loss: How much you lose when you're wrong.
Let’s say you win 50% of the time. When you win, you gain $200. When you lose, you lose $100.
EV = (0.5 × 200) – (0.5 × 100) = 100 – 50 = +$50
That’s a good system. You’d make $50 per trade on average over time, even though you’re only right half the time.
Two Trading Styles: Low Probability Big Win vs. High Probability Small Wins

Here’s where it gets interesting:
Some traders risk very little on each trade but accept a very low win rate, hunting for that rare 1% chance of a massive payoff. Think of it like buying a lottery ticket with a small stake and dreaming big. This style requires ruthless discipline to withstand frequent losses while holding on for that big win.
For example, a trader might win only 10% of the time, but those wins are five or ten times bigger than the losses. The math can still work:
- Win rate: 10%
- Average win: $1,000
- Loss rate: 90%
- Average loss: $100
EV = (0.1 × 1000) – (0.9 × 100) = 100 – 90 = +$10 per trade on average
On the flip side, other traders prefer high win rates but risk bigger losses when things go wrong. They might win 70% of their trades but have to accept a loss that’s two or three times the average gain when the market shifts unexpectedly.
- Win rate: 70%
- Average win: $150
- Loss rate: 30%
- Average loss: $400
EV = (0.7 × 150) – (0.3 × 400) = 105 – 120 = -$15 (a losing system, but tweaking risk/reward can fix this)
Both styles are valid but demand different psychological strengths and risk management.
The Risk-Reward Table Every Trader Should Know
Here’s a simple table to show what win rate you need to break even, depending on your risk/reward ratio:
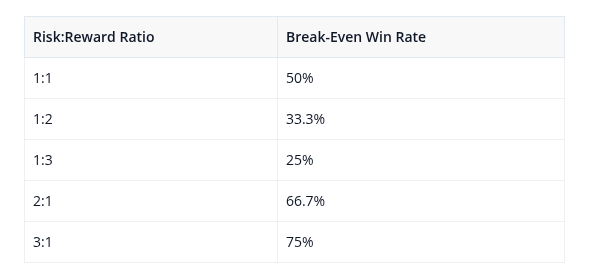

So if you only win 25% of the time, but your winners are 3x bigger than your losers—you can still make money.
That’s the magic of the math.
Position Sizing: Protect Your Capital, Protect Your Edge
Understanding how much to risk on each trade is as important as knowing when to trade.
Even a profitable system can blow up your account if you bet too much on a single trade. This is where position sizing comes in—deciding the amount of your capital you risk per trade.
A common rule is to risk no more than 1-2% of your trading capital on any one trade. This limits the damage from losing streaks and keeps you in the game.
If you risk $100 on each trade in a $10,000 account (1%), even a series of 10 losses only wipes out 10% of your capital, which is painful but recoverable.
Kelly Criterion: Finding the ‘Optimal’ Bet Size
If you want to get mathematical about position sizing, the Kelly Criterion provides a formula to calculate the theoretically optimal percentage of capital to risk:
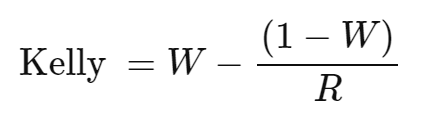
Where:
- WWW = Win rate (decimal)
- RRR = Reward-to-risk ratio
Example:
If you win 60% of your trades and your reward-to-risk ratio is 2:1:
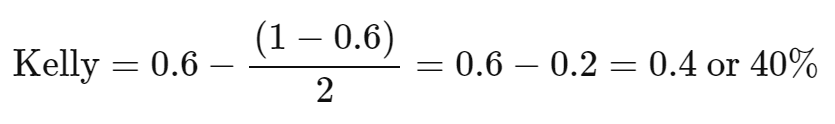
This suggests risking 40% of your capital per trade for max growth — which is far too aggressive in practice.
Most traders risk only a fraction of the Kelly amount — for example, 1/4 (25%) or 1/2 (50%) of that 40% — to reduce risk and emotional strain.
Real-World Frictions: Slippage, Fees, and Imperfect Execution
Your expected value calculations assume perfect fills at ideal prices. Reality isn’t so kind.
- Commissions and fees reduce profits, especially for high-frequency traders.
- Slippage means orders fill at worse prices than expected, especially in volatile markets.
- Liquidity constraints may prevent executing your plan at all.
These factors reduce your edge and must be considered in your risk and profit calculations.
Why Do Most Traders Lose Money?
Because the math is simple, but the mind is not.
You might want to stick to a system and trust your indicators, but after three losses in a row, emotions take the wheel. You deviate. You chase. You over-leverage. You take a setup that doesn’t fit your plan because “this one looks like it’ll work.”
Discipline isn’t optional in trading—it’s the edge.
Technical indicators aren’t worthless. They reflect human psychology: fear, greed, momentum, indecision. Moving averages show consensus. RSI shows oversaturation. Bollinger Bands? They're just volatility, dressed in lines.
But indicators are descriptive, not predictive. They don’t tell you what will happen—only what has happened and how people feel about it.
Behavioral Biases: Your Mind’s Hidden Obstacles

Trading success hinges as much on mindset as math. Common psychological pitfalls include:
- Loss aversion: losses sting more than equivalent gains please.
- Overconfidence: taking bigger risks after a string of wins.
- Recency bias: putting too much weight on recent trades.
- Confirmation bias: seeing only data that supports your thesis.
To combat these:
- Follow a written trading plan.
- Use alerts and checklists to enforce discipline.
- Keep a trading journal to track emotions and decisions.
- Take breaks and practice mindfulness.
The Risk Management Mindset
Here’s the truth: You can’t control your win rate. The market decides that.
But you can control:
- How much you risk per trade.
- Where you place your stop.
- Whether you follow your rules.
Risk management is the only certainty in trading. If you risk too much, one bad trade wipes you out. If you risk too little, you never grow. The balance is personal—but essential.
The Hardest Part: You Don’t Know What Works
You can backtest a strategy. You can optimize entries and exits. But until you put it into the real market—with real emotions and changing conditions—you don’t know the actual win rate.
And worse, that win rate might change over time. Strategies decay. Volatility shifts. What worked in a bull market may fail in a bear market or sideways chop.
That’s why adaptability and discipline matter as much as math. The goal isn’t to find a perfect system, but to build a resilient system—one that survives losses, adapts to changing conditions, and allows you to stay in the game long enough for your edge to compound.


