
From Bollinger Bands to Breakouts: How to Spot Big Moves Before They Happen

Introduction: Reading the Calm Before the Storm
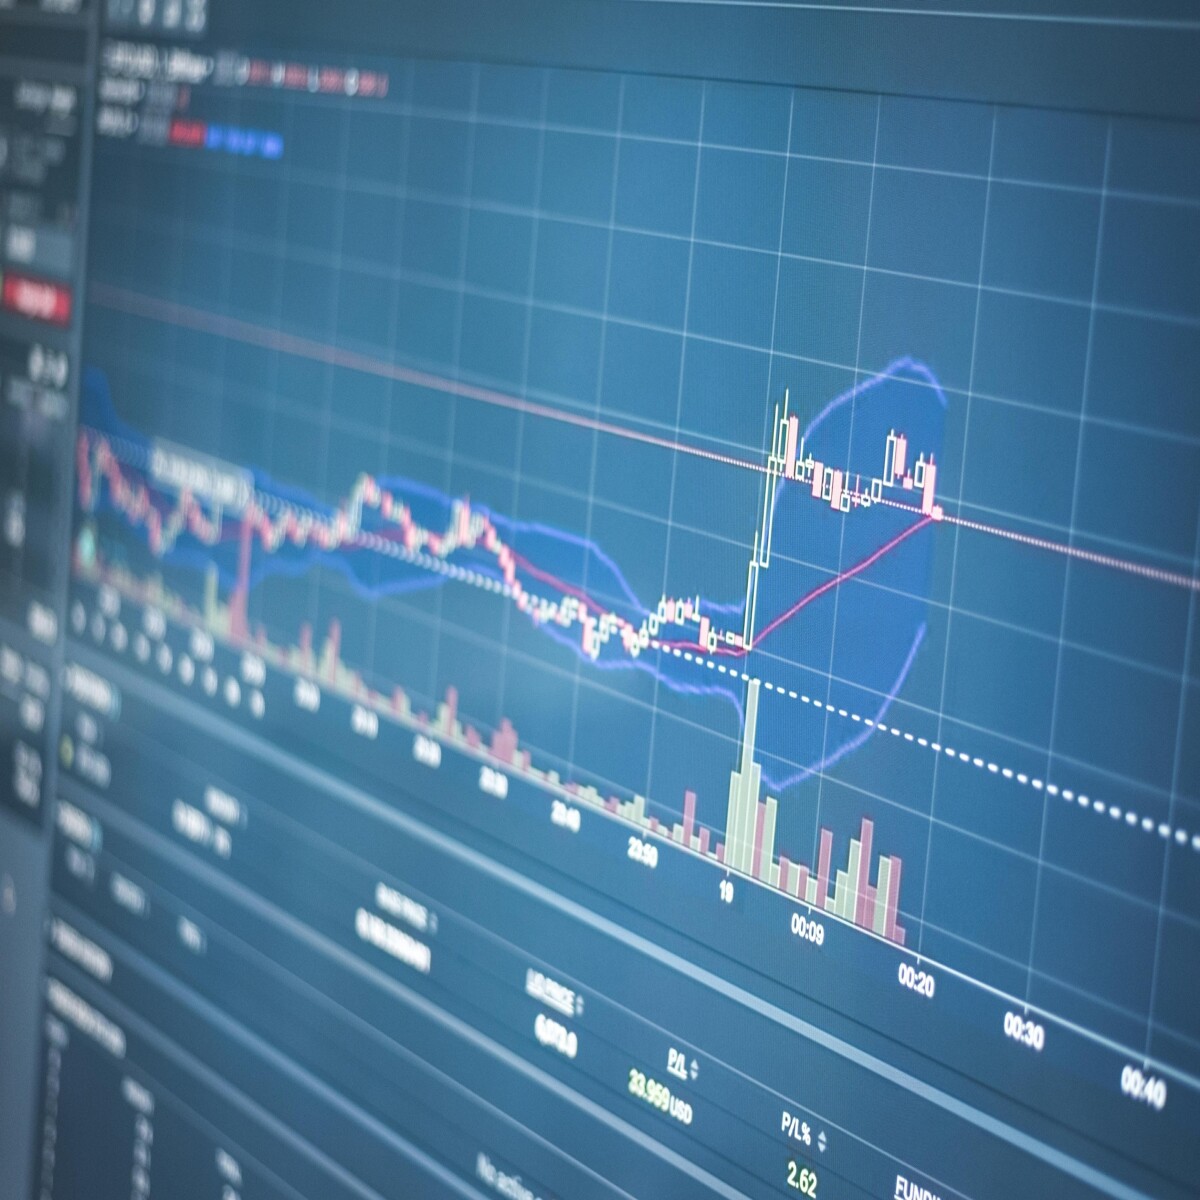
Financial markets often move in bursts. Periods of calm give way to sudden volatility, leaving many traders caught off guard. But what if there were a way to anticipate these breakouts? Enter the Bollinger Squeeze and its modern cousin, the TTM Squeeze Indicator by John F. Carter. These tools, rooted in volatility and momentum analysis, help traders detect when the market is coiling up energy—and when it might be ready to explode.
As Carter himself puts it, "Markets alternate between low and high volatility periods. When volatility is low, it is similar to a coiled spring, indicating an imminent price move."
This article unpacks the foundational indicators involved, how the Bollinger Squeeze works, and how the TTM Squeeze elevates it to a more refined breakout detection strategy—all while illustrating how I’ve personally applied these tools with success.
Key Indicators: Laying the Groundwork
Before diving into the squeeze strategies, it’s essential to understand the core indicators they rely on:
1. Average True Range (ATR)
ATR measures market volatility by calculating the average range between high and low prices over a given period. Unlike standard deviation, which is used in Bollinger Bands, ATR reflects absolute price movement, making it a core component of Keltner Channels.
2. Bollinger Bands
Created by John Bollinger, these bands envelope price action with two lines placed a number of standard deviations above and below a moving average. The bands expand when volatility rises and contract when volatility drops. This contraction often precedes a price breakout, making it a powerful signal generator.
3. Keltner Channels
Like Bollinger Bands, Keltner Channels are volatility-based envelopes, but they use ATR instead of standard deviation. The result is a smoother, often more stable channel that reacts differently to market conditions.
Key Difference: Bollinger Bands respond to statistical volatility; Keltner Channels react to absolute price range.
The Bollinger Squeeze: When Volatility Dries Up
The classic Bollinger Squeeze setup occurs when the Bollinger Bands contract inside the Keltner Channels. This compression signals a period of low volatility and suggests that the market is storing energy for a possible breakout.
How It Works:
- Bollinger Bands contract inside the Keltner Channels.
- Market enters a "squeeze" condition.
- Traders watch for a breakout beyond the bands to determine direction.
Why It Matters:
This setup helps traders anticipate volatility before it happens, rather than reacting to it after the fact. I’ve seen this time and again—especially when my market scanner triggers multiple setups during periods of sector-wide coiling.
Enter the TTM Squeeze: Carter’s Refinement of the Strategy
John Carter’s TTM Squeeze Indicator builds upon the Bollinger Squeeze by adding a momentum histogram to the equation. This histogram provides insights into the direction and strength of the likely breakout.
Carter explains: "The momentum histogram used in the Squeeze helps estimate the direction, velocity, and potential turning points of the market, providing critical insight alongside volatility compression."
Components of the TTM Squeeze:
-
Volatility Squeeze:
- Triggered when Bollinger Bands contract inside Keltner Channels.
- A red dot appears in most TTM Squeeze visualizations, signaling a squeeze is on.
-
Momentum Histogram:
- Green bars: increasing bullish momentum.
- Red bars: increasing bearish momentum.
- Fading momentum (smaller bars): potential reversal or pause.
When the Squeeze "Fires":
When the Bollinger Bands break back outside the Keltner Channels, the squeeze is said to "fire." Traders then look to the histogram to anticipate whether to go long (bullish) or short (bearish).
My Strategy: Discipline Meets Data
While the TTM Squeeze is a valuable tool, its real power shines when paired with a well-defined personal strategy. Over time, I’ve refined a bullish, data-driven approach to trading squeezes with discipline:
1. I Only Take Long Trades
I exclusively focus on bullish trades, seeking upward momentum and avoiding shorts entirely.
2. The CNN Fear & Greed Index Must Be Above 50
Before considering a trade, I check the CNN Fear & Greed Index. Only when the index shows greed (above 50) do I proceed, ensuring the broader market sentiment supports bullish trades.
3. Momentum Histogram Must Show at Least 4 Rising Green Bars
To confirm growing bullish momentum, I require a minimum of four consecutive rising green bars on the TTM Squeeze histogram.
4. Entry Above the 21-Period EMA
I wait for the price to break just above the 21-period Exponential Moving Average before entering, confirming an uptrend is gaining traction.
5. Check Sector Alignment
I ensure the sector of the target stock is also showing bullish strength or is in a squeeze. Sector momentum often amplifies individual stock moves.
6. Multi-Timeframe Confirmation
For a high-probability setup, I confirm that the squeeze is present across multiple timeframes—such as the 4-hour, daily, and weekly charts.
7. Python-Based Market Scanner
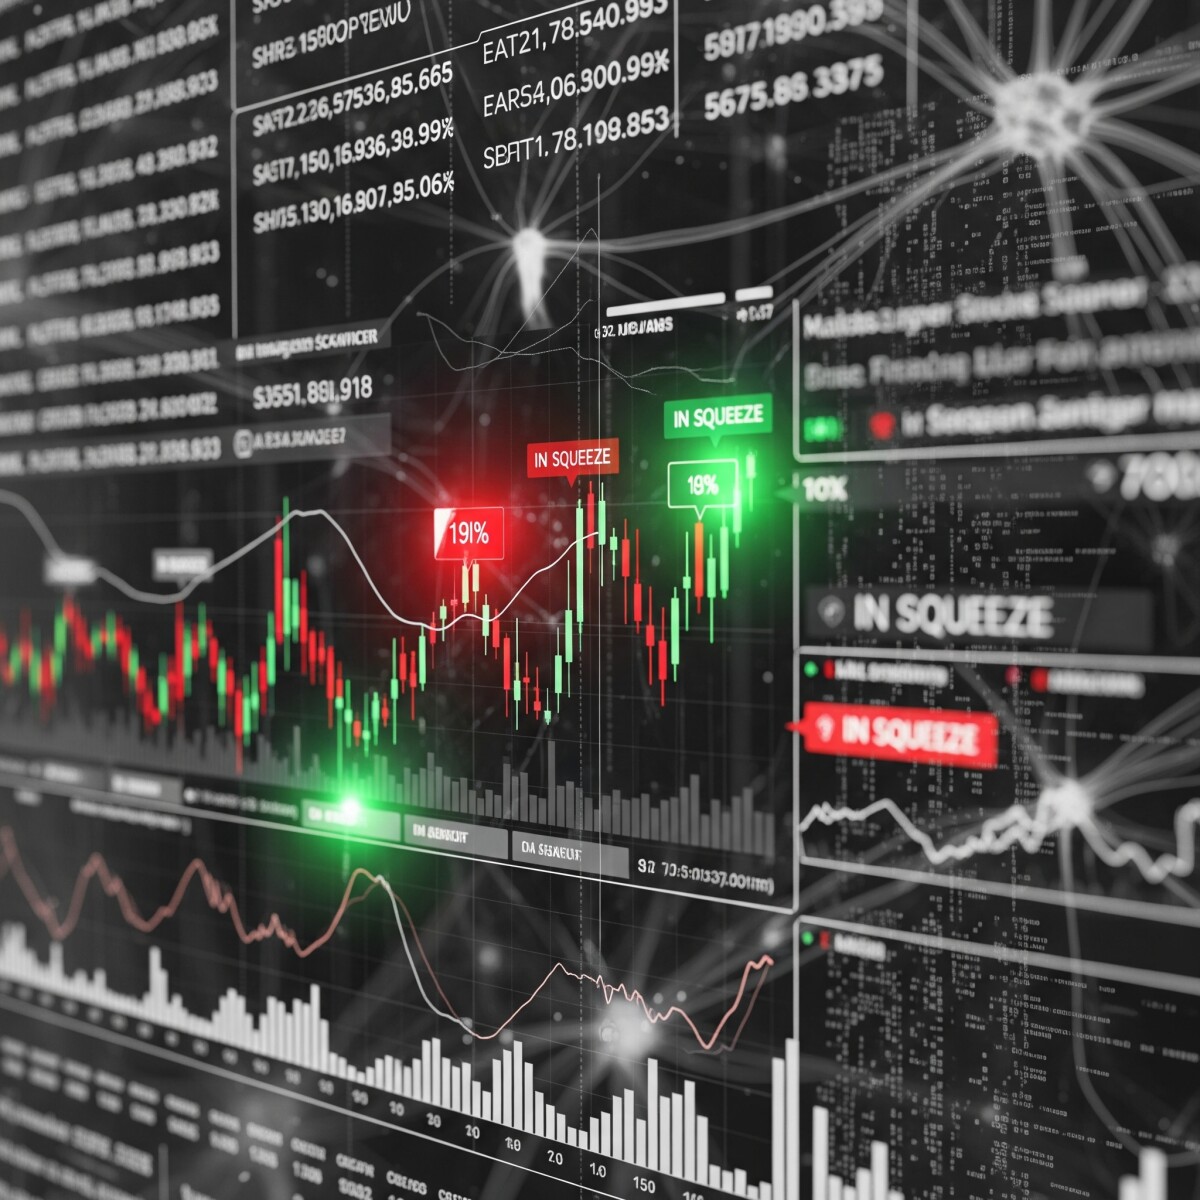
Here’s where I turn the tables: I don’t sit around watching specific stocks for a squeeze to form. I’ve built a Python tool that scans the entire market, surfacing stocks that are already in a squeeze. The stocks find me.
Each week, depending on market conditions, I narrow the list down to about 10 high-quality squeeze setups—and I typically take a position in fewer than 50% of them. Selectivity is key.
“The squeeze is about patience—waiting for the pressure to build. But it’s also about preparation—knowing how to act when the moment arrives.”
Why It Works: Volatility Precedes Price Movement
Markets are cyclical. Quiet phases are almost always followed by periods of high activity. The TTM Squeeze doesn’t just help identify this transition; it attempts to time it and predict the direction.
This makes it especially useful for:
- Swing Traders looking to enter before a breakout.
- Day Traders seeking high probability setups.
- Options Traders capitalizing on rising implied volatility.
Market Conditions Matter: Confirm with Sentiment Tools
While the TTM Squeeze can signal a breakout, context is critical. The Fear and Greed Index, for example, can offer additional clues:
- High Fear = Bearish sentiment; consider short setups (if trading both directions).
- High Greed = Bullish sentiment; a green light for long setups.
Combining sentiment with technical signals helps filter false breakouts and align trades with the broader market mood.
Conclusion: Timing the Market's Pulse

The Bollinger and TTM Squeeze strategies don't guarantee profits, but they equip traders with a structured way to identify and act on price compression and momentum shifts. When used in tandem with solid risk management, sentiment tools, and a defined personal plan, they offer a distinct edge.
As Carter succinctly puts it, "The Squeeze identifies these periods of low volatility and aims to help traders position themselves before price explodes."
For traders seeking to anticipate—not chase—the next big move, understanding and mastering the TTM Squeeze—within a framework of personal rules—could be the difference between watching the breakout... and riding it.
Further Resources
- Book: Mastering the Trade by John Carter
- Tools: Thinkorswim, TradingView (TTM Squeeze Indicator available)
- Community: Reddit (r/Trading), Trading Discords
- Sentiment Gauge: CNN Fear & Greed Index


