Have you ever felt that this trading thing sounds interesting? But when you start to look into it, it is just a jumble of charts and numbers. And you can't make any sense of it. Well, I certainly have. That's why I started to teach myself what charts and numbers meant. And while I am by no means an expert. I do have a firm grasp of the basics. Hence this post. I thought I would try and share with you some of what I learned so you as well can have a better understanding of what you are looking at.
My first few run-ins with trading
Unless you are familiar with how it works from some other place. I was. It is all pretty much looking like a jumble of lines. Sure I get the basic idea of charting prices over time. But what is up with the different charts? Why do they call things “candles”? My questions were becoming way too many compared to the number of answers I where able to figure out. It was quite overwhelming to try and take in and make sense of all that information at the same time.
Because of that, I decided to do the only sane thing I could think of at the time. Leave it alone. As the saying goes if it ain’t broke don’t fix it. And as I was not even sure what the “it” was to begin with. I thought it was probably the smartest thing to do to leave it alone. But I did, however, swear that I would be back and then there would be a lot of “fixing it”, I just needed to figure out the “it” part first.
Starting with the basics
I slowly started to learn this and that as I watched videos where they analyzed different charts. But I still felt like I was lacking a solid foundation to stand on. It was more akin to putting up walls and a roof but entirely skipping the floor. It might look nice to start off, but it would probably fall apart pretty fast. That lead me to do some more research. Because if I were to build a house I am starting with a solid foundation.
The most basic thing of them all is to understand what the graphs show. Most of them show the same thing. I say most as there are probably a few that work differently. But I will explain the most common type of graphs you will run into. They have two axes, one that goes left to right, and one that goes up and down. The one that goes left and right is in math called the X-Axis. And the one that goes up and down is called the Y-Axis.
In trading, the X has been replaced with Time. This means if we move to the left we will go back in time. And unless we are looking at a historical graf we can not move to the right. As that would put us in the future. The Y has also been replaced. This time not by time, but by price. If we move up, the price increases, and if we move down the price decreases. Each point on the graph, therefore, represents the certain price the commodity had at a given time.
This is the very basis of how the graphs work in trading. What is important to note is the values on the time and price sides. As these can vary. Most of the price will be displayed in either your native currency or the USD. And the increase and decrease steps can, in theory, be made as big or small as you like. But are generally kept in proportions that make sense. This is because no one is really interested in knowing the price of a Bitcoin down to the cent level when one Bitcoin is worth around $30,000. But if you take another coin with a low per-coin price, then cents or even 1/100 of a cent can mean a huge deal in terms of % value. This means it is always a good idea to check what intervals the time and price is shown in.
Candle chart
Now we can take a look at an actual type of chart. I think this also is the one that is most commonly used. And that is the Candle Chart. I assume it gets its name because each data point looks like a candle. And talking about data points, they look like this on a candle chart. Its origin tho is Japan and its use dates back a few centuries.
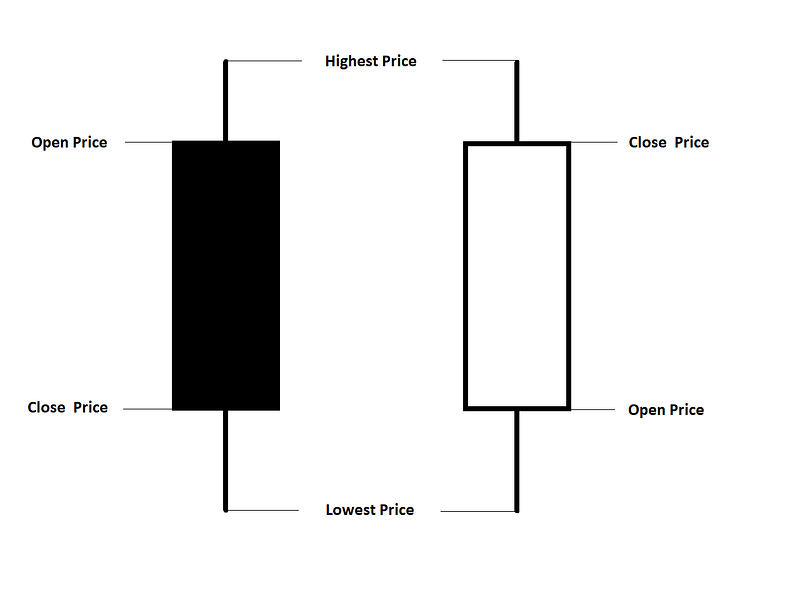
The two types of candles, one with a full body and one with an empty body. This can be shown by using different colors as well
Each data point consists of two things, the main body. That is what gives this its name, the candle. And the high and low points, the wick. and there can be two wicks on each candle, one above and one below the main body.
The difference between the solid black body and the white body is the start and stop points for the body. The black body, often shown in red, has its open price up top. This means for the time duration the data is relevant the price has dropped. It is lower at the end of the time period than it was at the start.
And of course, the opposite is true for the white, often green, bodies candle. It has its Open Price at the bottom, and when the measured time was up, the price of closing was higher than at the start.
We will not take a look at the Bitcoin/BUSD trading view on Binance.
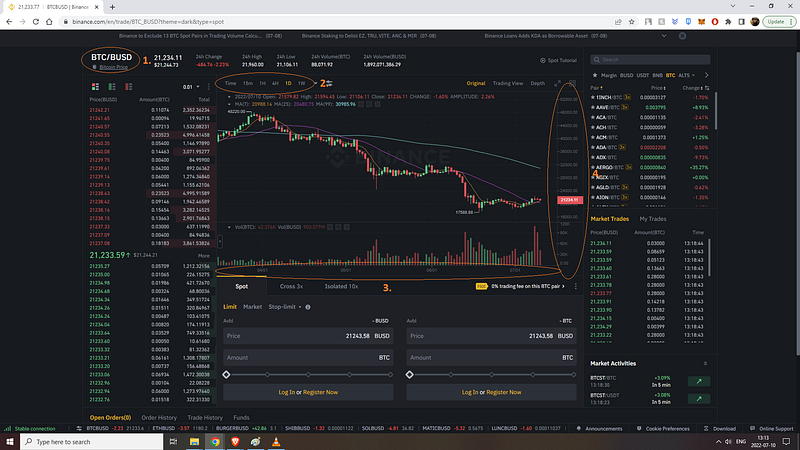
An older screenshot of mine, so do not expect to find any Bitcoin at this price
1. Is the trading pair. It tells you what two commodities you can trade with each other. Here it is Bitcoin and BUSD. To be exact it is Bitcoin per BUSD. Meaning the price is how many BUSD 1 Bitcoin is worth.
2. The time setting. This will allow you to change how much time each candle will represent. Here it is set to 1 day. Meaning each candle represents 24 hours.
3. The x-axis, shows you the time. When the setting is 1 day, each step on the x-axis is 1 day or 24 hours, that is why you see dates there.
4. The y-axis, shows you the price. The price is displayed in the trading pair. This means that 1 bitcoin will give you 21.234,11 BUSD at this time. It is important to note that the trading pair dictates the price. If the pair would be Bitcoin/DOGE then the price would be vastly different because DOGE is valued much lower than $1 as BUSD is.
Trading pair
The trading pair simply means that you can trade one for the other. And the trading pairs available on a site are often limited to a few. The more popular a cryptocurrency is the more available pair are available usually. And if you are looking for a certain par to trade then you might have to look at a few sites in order to find it. If it is available at all.
Most CEX, or Centralized Exchanges, have their own token or Coin. And they will premiere that of course. On Binance as an example, you would expect to be able to trade BUSD for basically anything that is available to trade. And by far the most common type of pair is any crypto paired with a stablecoin. But different CEX will premiere different stablecoins.
Making the trade
When you make a trade you are placing an order. You enter the price you want to buy or sell the crypto for, and how many you want to buy or sell. Then you confirm the order. It is then placed in the queue, depending on the price you have asked. If you look at the left side in the picture above you will see the trad queue. Here you can see all the buy and sell orders placed by others.
And as soon as someone places an order to either buy or sell the crypto for the asked price that order gets “filled” or executed. At the very bottom on the left side, you are able to see the text “Open Orders(0)”. This tells you how many orders you have in the queue. And if you scroll down you would be able to see the orders and cancel them if you would be so inclined. This is important because it allows you to place a buy order for a much lower price than the current price. If you expect or hope the price will drop. And as well the opposite is true. If you want to sell at a current price that you hope will be reached then you can put that order in and it will be fulfilled if the set requirements are reached.
As I use Binance as my main CEX and on-ramp. An onramp is where you traditionally can swap money for crypto and vice versa. I felt it easier to use it as an example. And if you use another platform or dApp to trade the look might vary. But the general information will be the same. And if you look around a little and make yourself accustomed to it I am sure you will find that the exact same features will be there. But maybe where they can be found is different or what they are called.
Now you are ready to start trading crypto, or any other thing of you're choice. There are many different types of trades you can make, but I have not, not yet at least, dug into how they work and what makes them different. And I see them as more of an advanced level.
I hope that you have found this post to be informative and educational. And if I have made any mistakes or errors please point them out so I can fix them. And if you have any questions post them as well in the comment section down below and I will try and answer them as best I can.
If you would like to support me and the content I make, please consider following me, reading my other posts, or why not do both instead. I have also just become a partner at Medium, signing up using my referral link or just following me there is also a great way to support me.
See you on the interwebs!
Picture provided by: https://pixabay.com/, me