
Hey Folks,
Hope everythings alright on your side! I'm coming at you with a small update on the last Breakdown Analysis. https://www.publish0x.com/thecryptohack1/bitcoin-broke-its-consolidation-pattern-what-now-xjnjxe
Lets get straight into it without much words shall we?
The last time i posted this one here
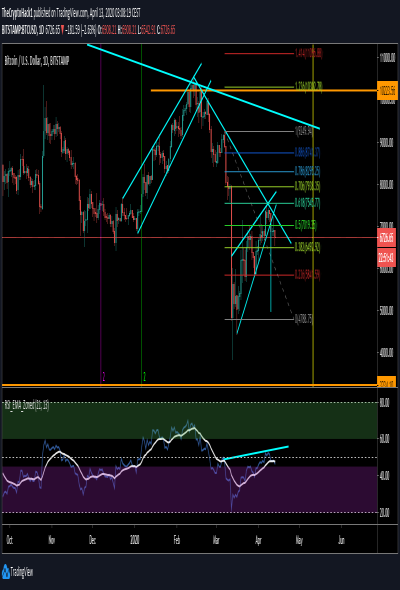
So lets build up on that on a lower timeframe, the 4hour Chart now.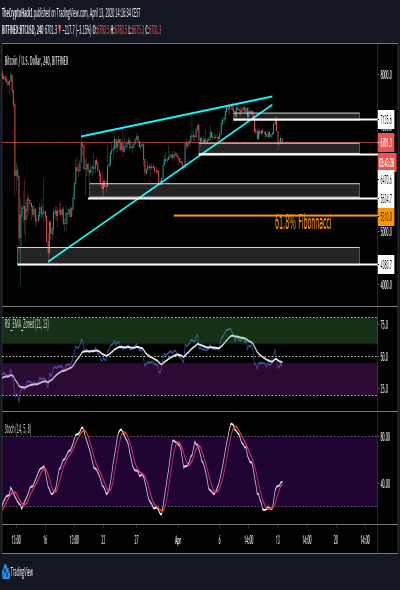
As you can see Bitcoin fell and found support at around $6570, the prices bounced from that level and tested $6.840 before coming back down. What need to happen for me now to confirm my yesterday bias to the downside? A H4 candle break to the downside would further confirm it, its indicated in the chart as a red arrow.
But what if bitcoin goes up? I stay with my downside theory as long as bitcoin is trading below $7.300 indicated as the green arrow. This would turn me bullish if Bitcoin can close atleast 4hour candle above the 7.300 Level.
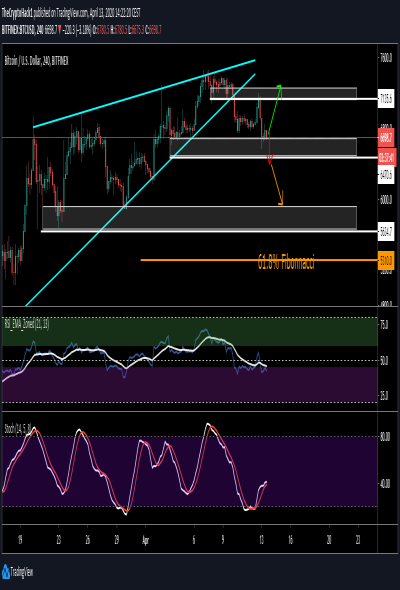
I will keep you updated on this one as it plays out. I see the probability still higher to go down. But all the areas marked with the white support zones are potential bounce areas. Also never ignore the 61.8% Fibonacci ratio!
Stay safe, Stay healthy and enjoy Life!
Or Check out the Brave Browser!
Do NOT trade based on what you see in this analysis. You should only trade based on your knowledge, experience, and risk as a trader. This information is for educational purpose only. Trading in any market contains a high degree of risk. Always seek advice from a licensed financial planner or adviser.


