
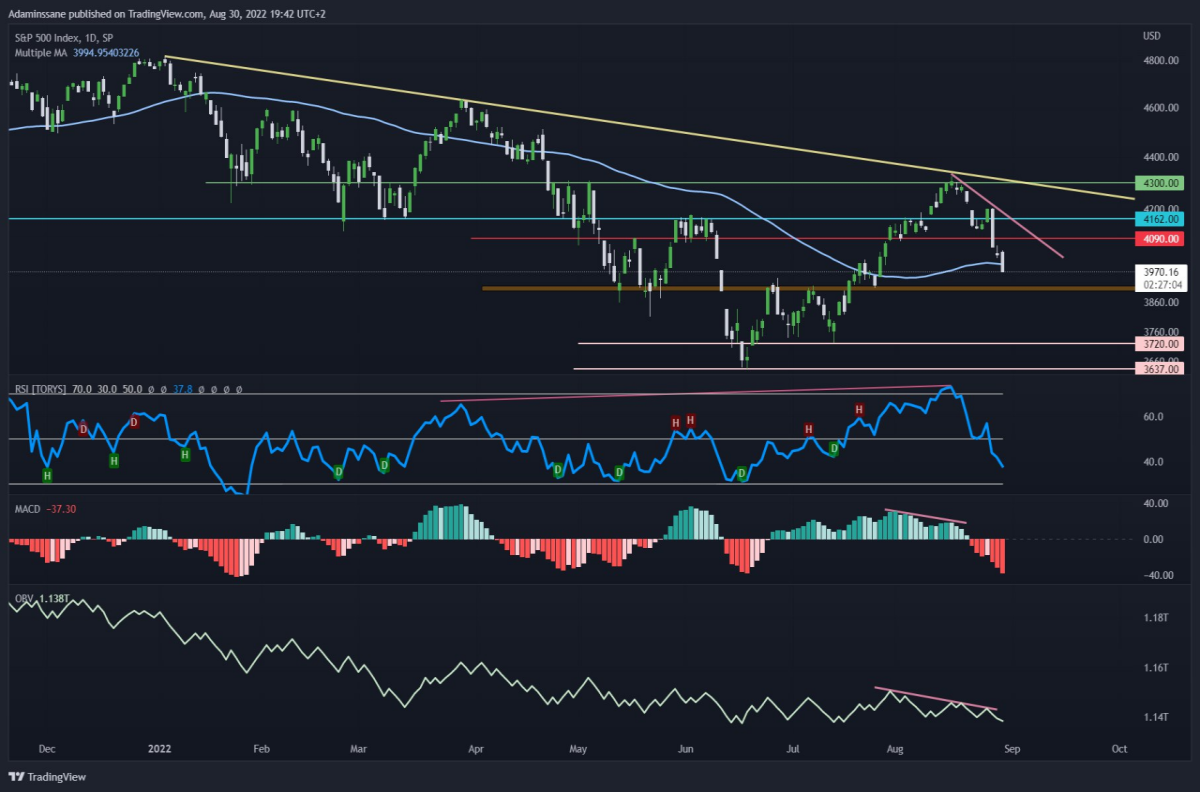
The bearish divergence (RSI / MACD / OBV) on the S&P 500 is confirmed after the crossing below the level 50 of the RSI, the break below the MA 62, and a lower low.
The sellers are still present, and we see it on the Momentum via the MACD which is strongly bearish.
The next key zone of dynamic support will be between 3900 to 3920 and on BTC will be between 19K to 19.3K and if this zone doesn't hold on the S&P500 I think we will go lower than the last 2 bottoms at 3720 and 3637 the equivalent on the BTC at 17.6K and 16K to see 14.6K!
It's possible that we can go bullish, except we have a lot of obstacles in front of us like several resistances, and also the market in loss of liquidity with buyers who do not have enough strength, and news not at the top like rising inflation.
- S&P 500: https://www.tradingview.com/x/3oLW5XGc/
👉 Please follow the links below to the best & Secured Exchanges that I use for trading & often gives rewards for using their platform like Learn & Earn Program, making deposit & Trading on spot or Futures, Trading Competition, ...etc.
📈 Binance: https://www.binance.com/en/register?ref=12258276
📈 FTX: https://ftx.com/#a=1768923
📈 Bybit: https://www.bybit.com/app/register?ref=7Wgmj
📈 Phemex: https://phemex.com/register?group=718&referralCode=BAR9K
📈 Bitmex: https://www.bitmex.com/app/register/xXePh3
📈 Kucoin: https://www.kucoin.com/ucenter/signup?rcode=Kvyf2d


