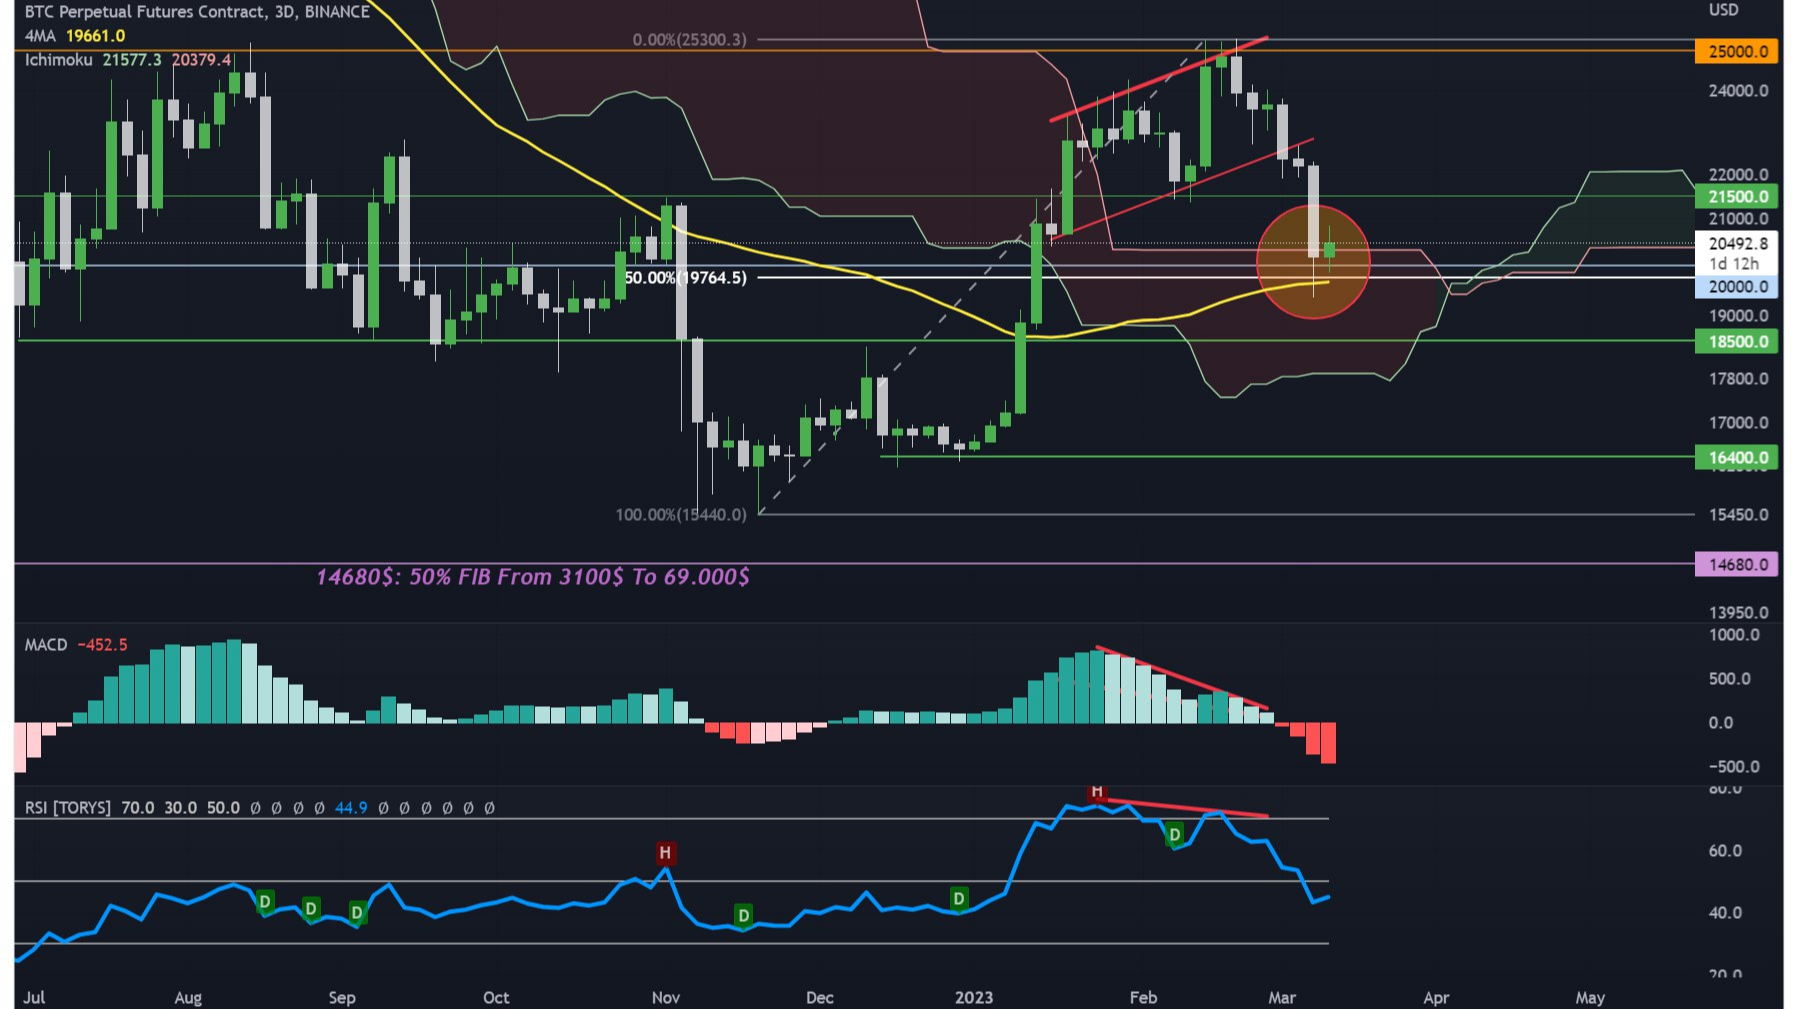
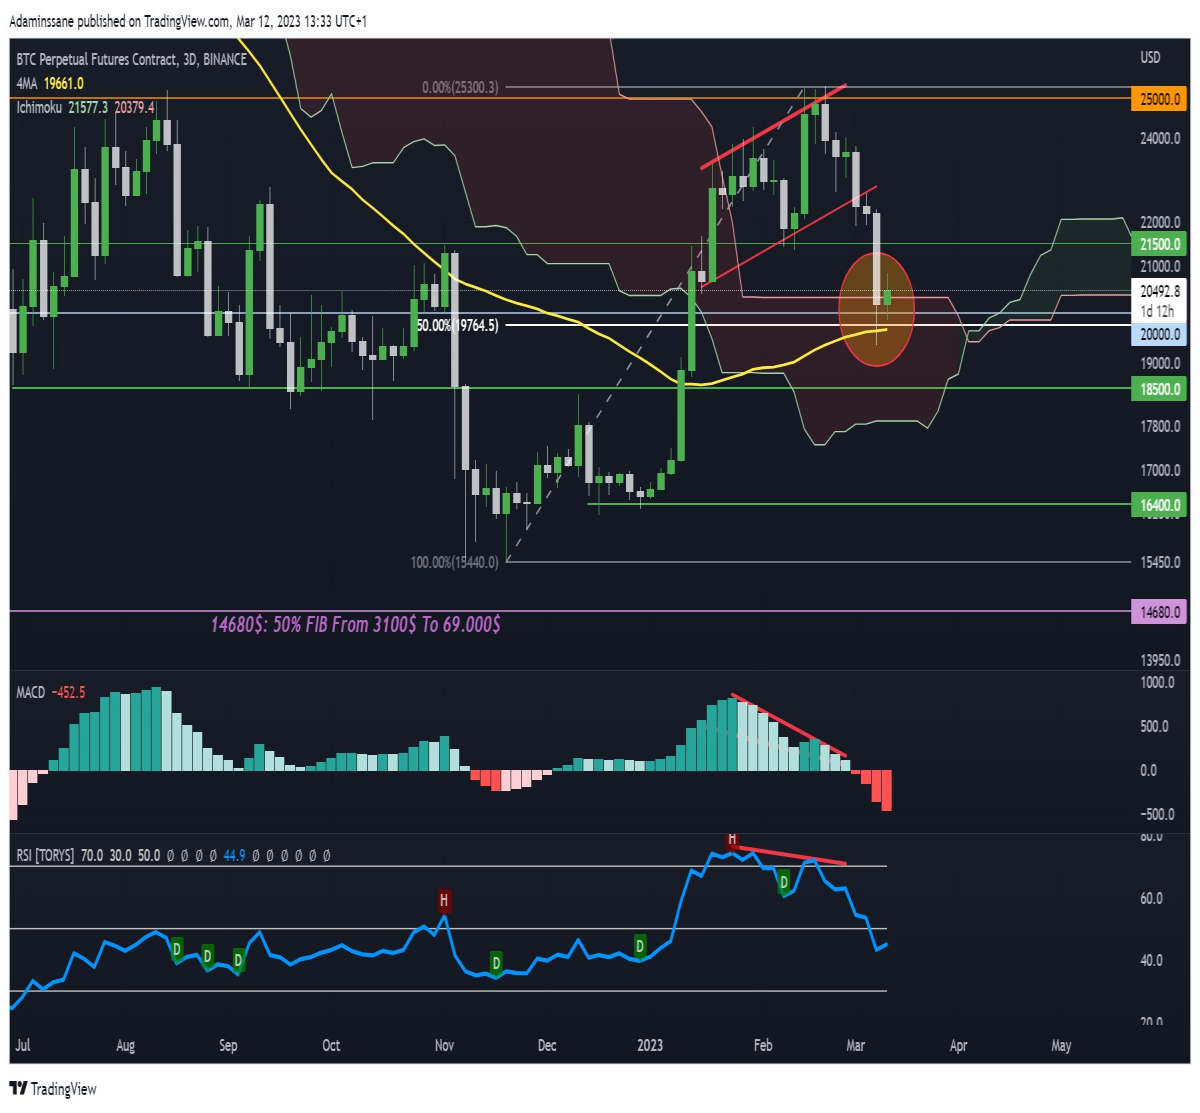
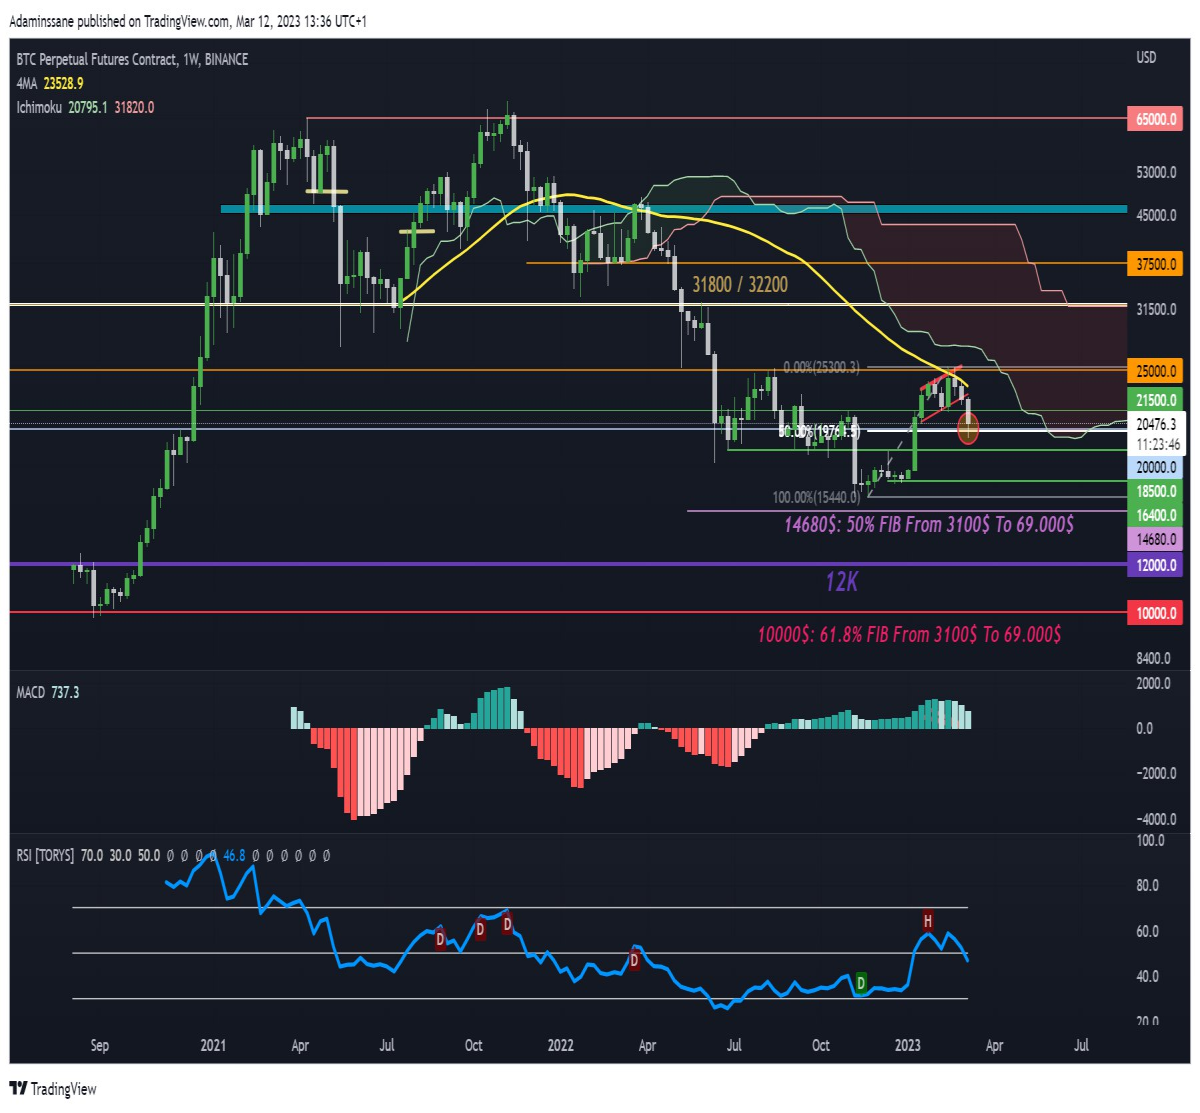
BTC in 3D is on a key support level of 20K (the old ATH of 2017), and for the moment we have bullish signals towards a rebound at least in the short term, but in Weekly we always remain bearish as long as we are at the bottom of the 25K, the Ichimuku cloud and the MM 50.
The confluence zone in 3D:
- The top of the cloud.
- The 50% fibo.
- The MM 50 as support.
BTC in 3D: https://www.tradingview.com/x/mHezPKIk/
BTC in Weekly: https://www.tradingview.com/x/oMh5sMFw/
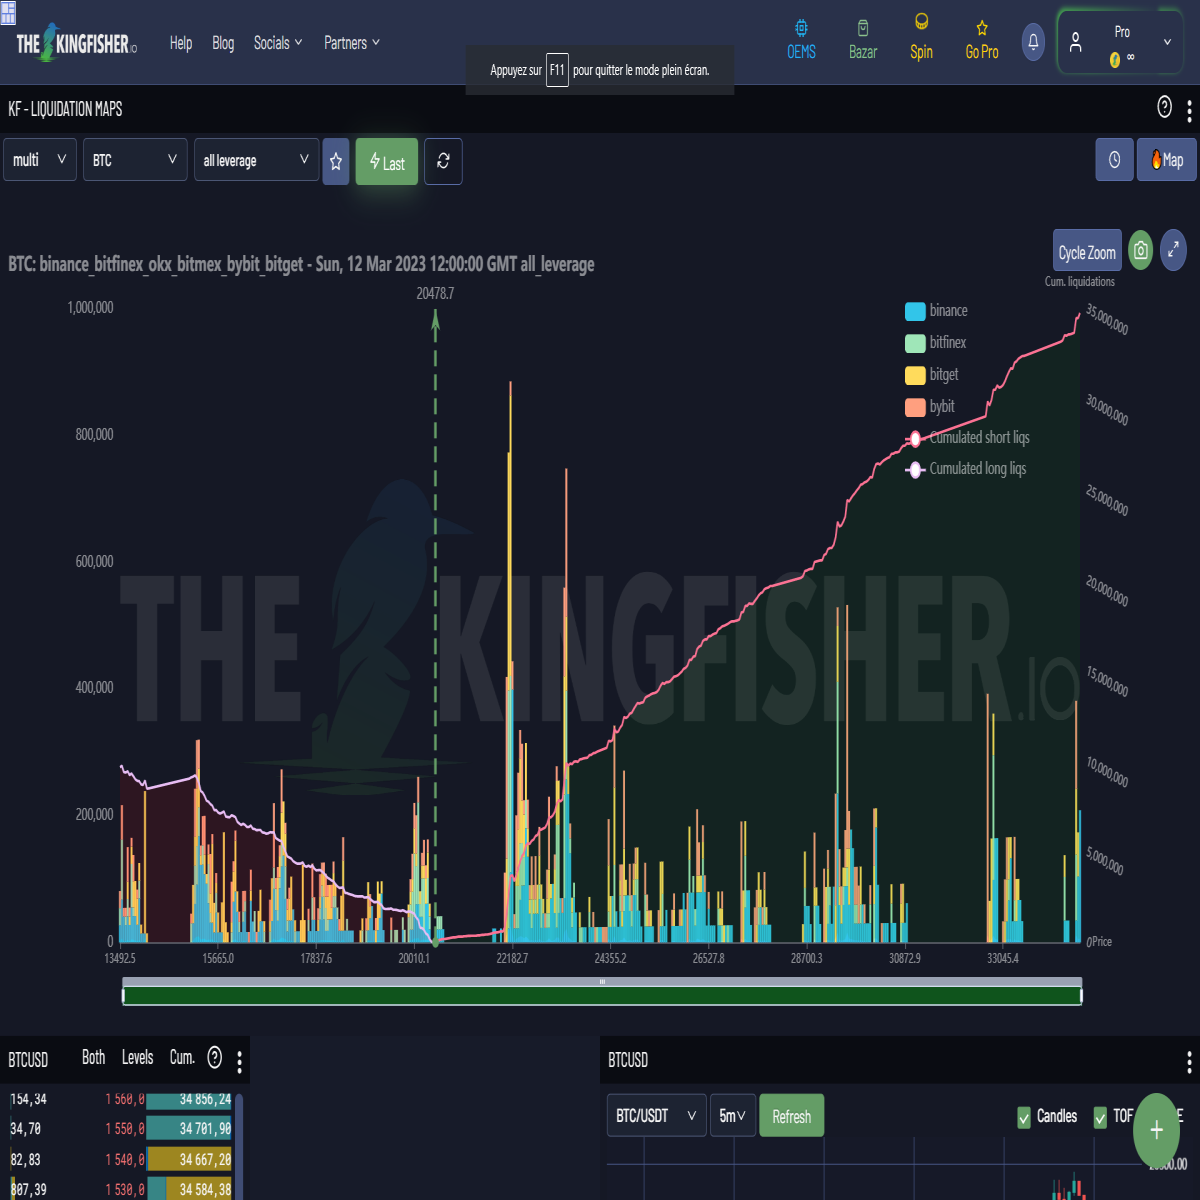
Too many shorts on the balance, possible a short-term bear trap to look for the 22K, but to pay attention to the macro with the S&P 500 and the Dollar DXY, and especially the consequences of BTC against a very bullish dollar which can bring us back below 20K with force to look for the 18.5K and then the 16.4K and lower than the last bottom at 15.5K!
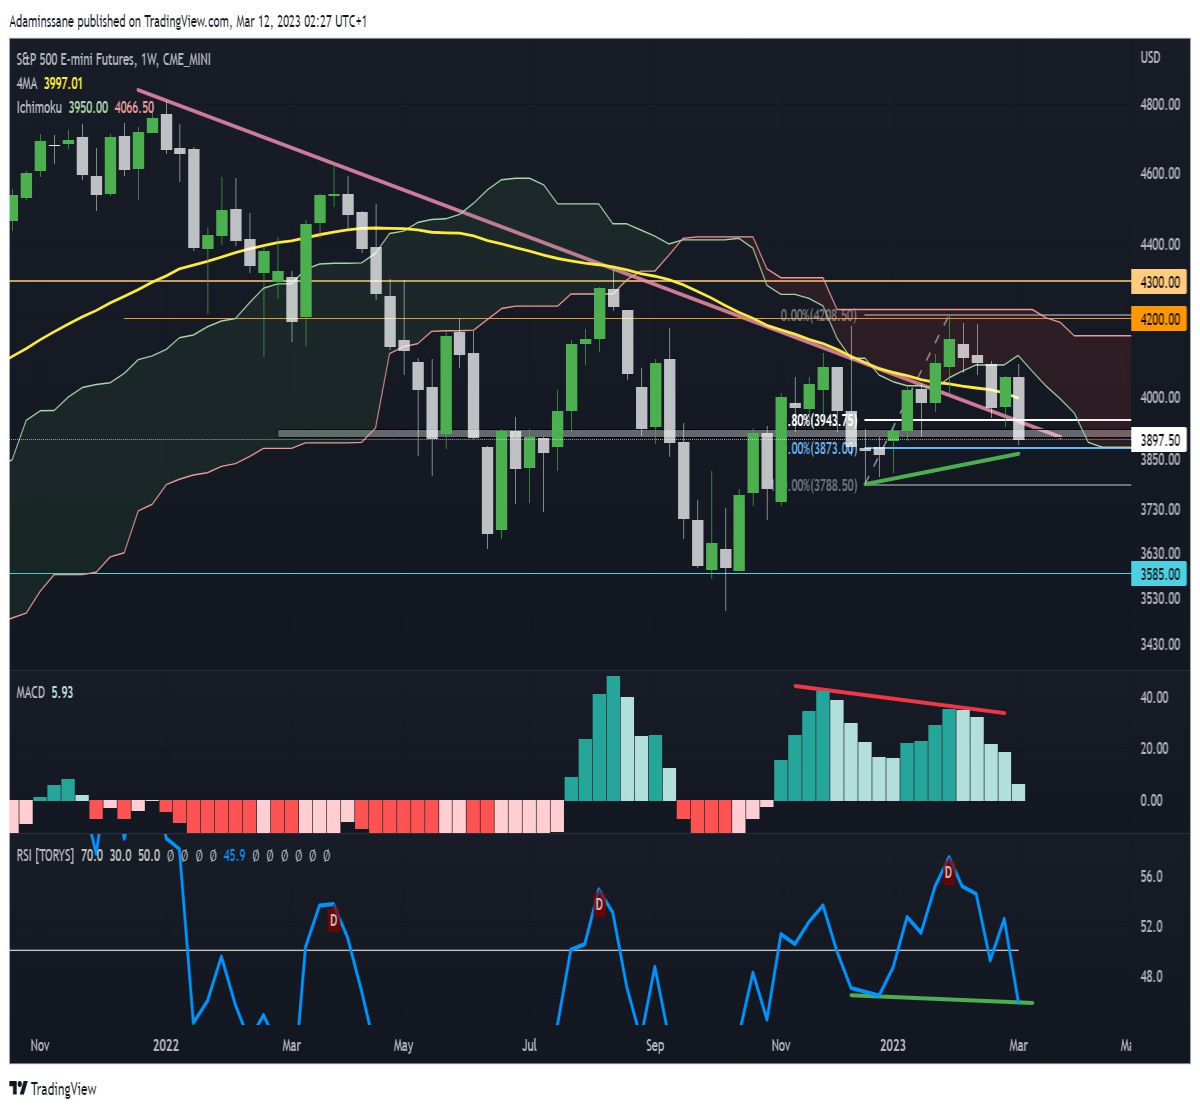
The sellers on the S&P 500 moved into action on Friday to close below the long-term trend line and the Weekly 50-MA after rejection from the top of Ichimuku cloud as resistance.
The Weekly close despite being made with a large red engulfing candle, and an RSI below 50 with weak buying momentum on the MACD, there are some bullish signals like the small bounce above the 79% fibo in the area from OTE, a bullish divergence on the RSI, and the key support level at 3900 which has held for now!
To confirm that it's not a fake break out from the bottom after the fake break out from the top, I think that this time we have more chance that it's a real one since it follows the trend, but looking at smaller times frames like 3D and 1D and see if we have a lower low, or a pattern of candles like the long wick, or an engulfing candle, divergence, patterns...
Next week will give us more clues on what to do next!!!
https://www.tradingview.com/x/h7fi3A9c/
The Dollar Index DXY in Weekly time frame is under resistance in confluence with many indicators as I explained in March 7th on Telegram, and yesterday we closed the week with a bearish candle that has a long wick that got rejected by the top of the cloud. and the MM 50.
- DXY 7th, March on Telgram: https://t.me/Adaminssane1/19807
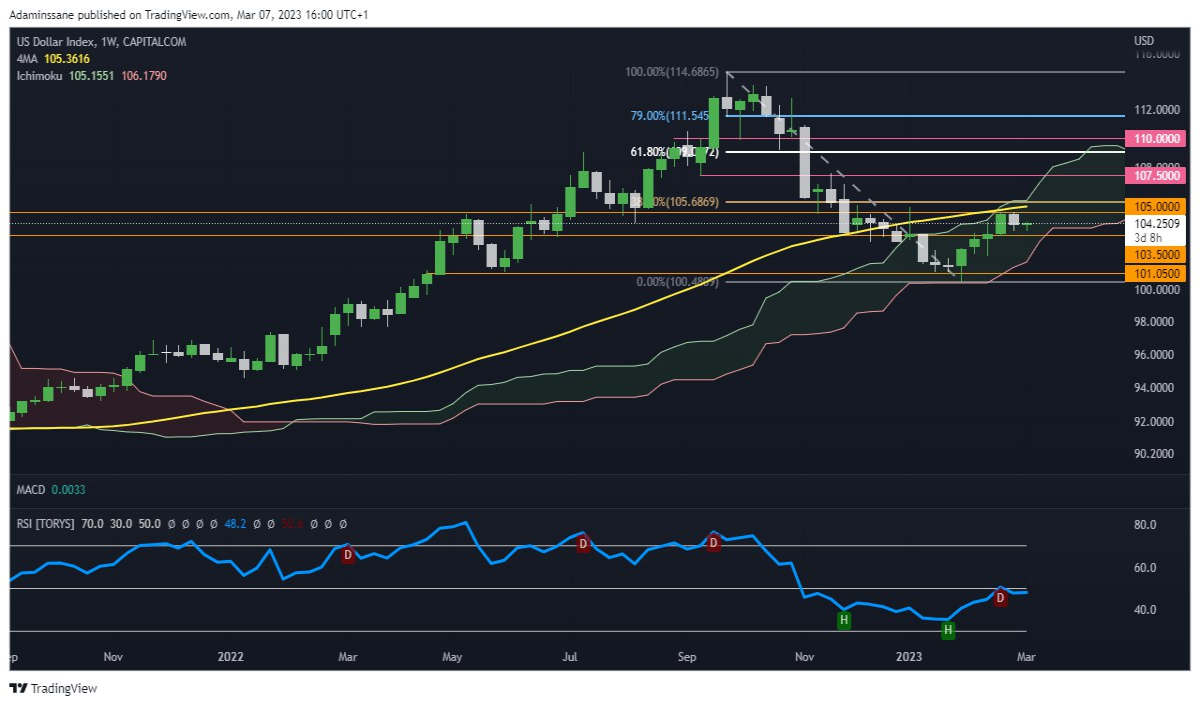
- DXY Weekly Candle Close: https://www.tradingview.com/x/zFRHqowv/
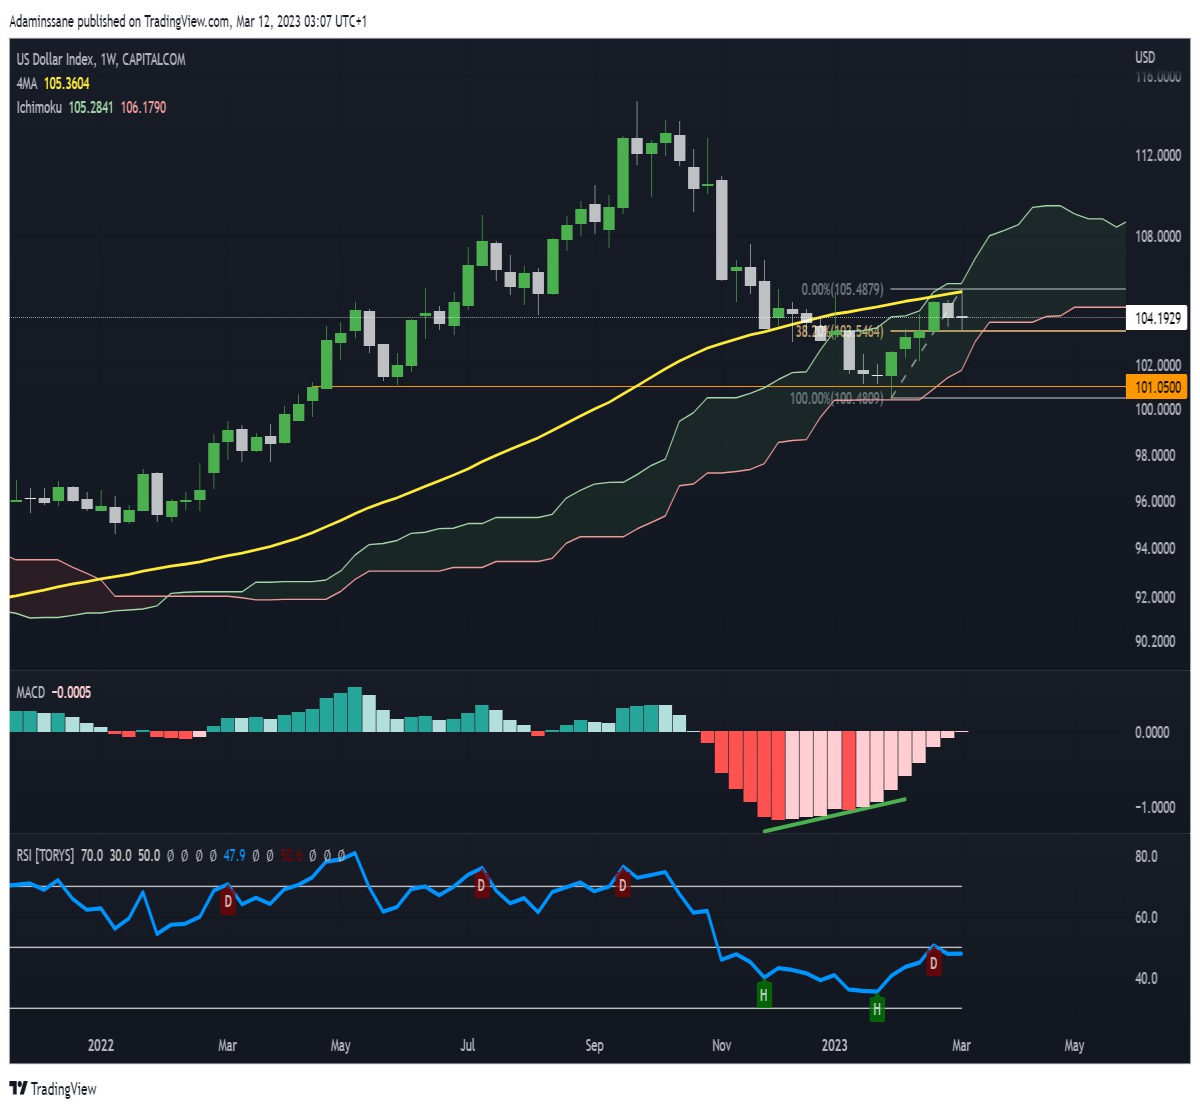
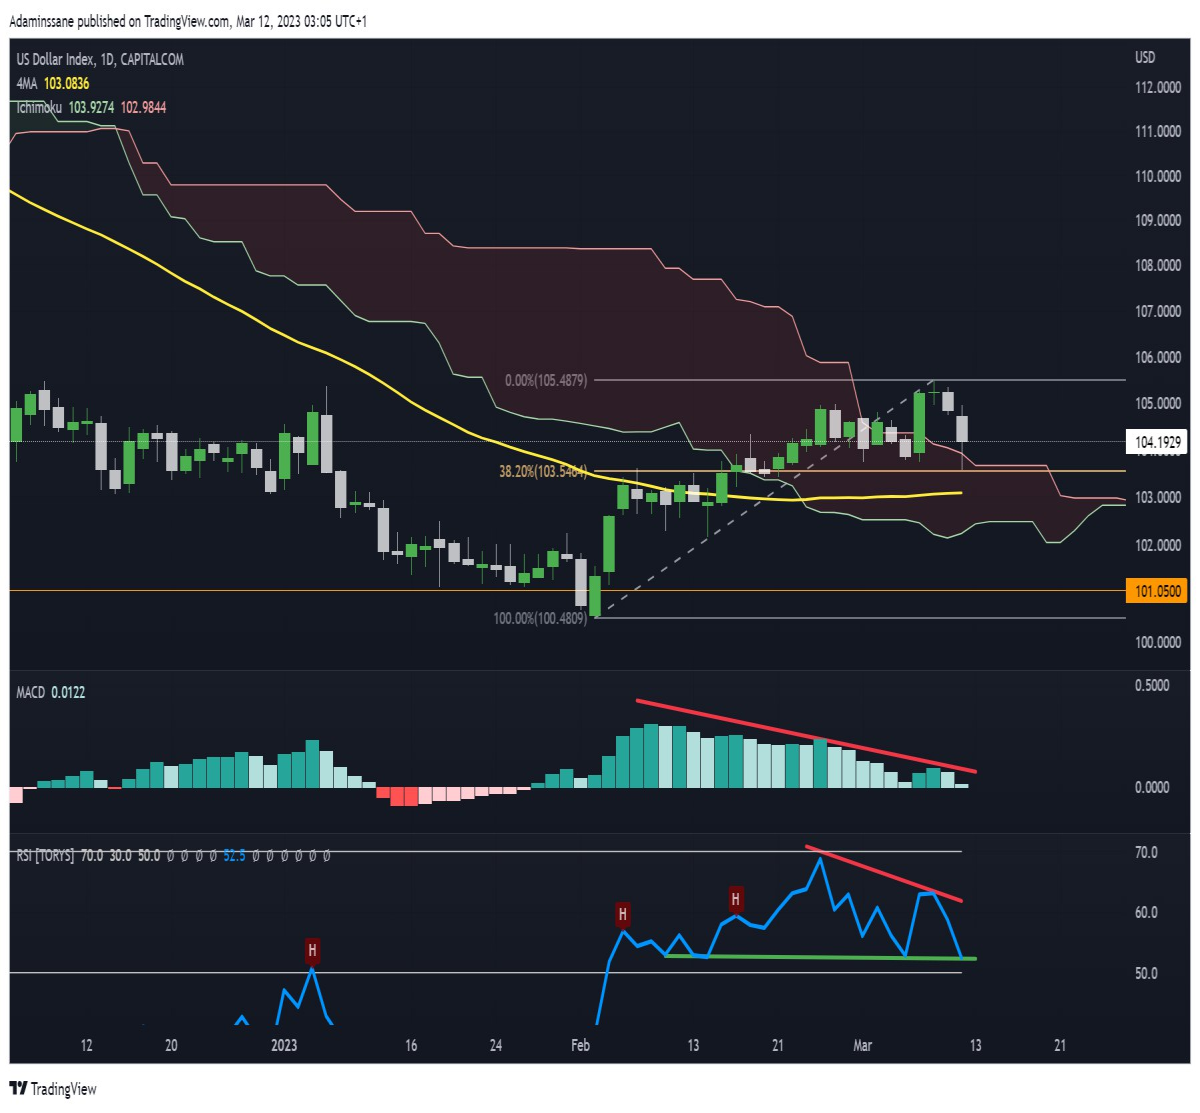
The DXY in Daily is the opposite, it is bullish after the passage above the cloud and then the rebound on the 38.2% fibo with bullish divergence on the RSI.
I conclude that the times frames do not say the same thing, to see next week which time frame will have more weight, often the largest like the weekly against the Daily, and to avoid doubt will wait for the Daily to also say the same thing, and it's already starting to show the return of sellers in Daily after bearish div on RSI and MACD losing Buy Momentum.
https://www.tradingview.com/x/hcU48vV9/
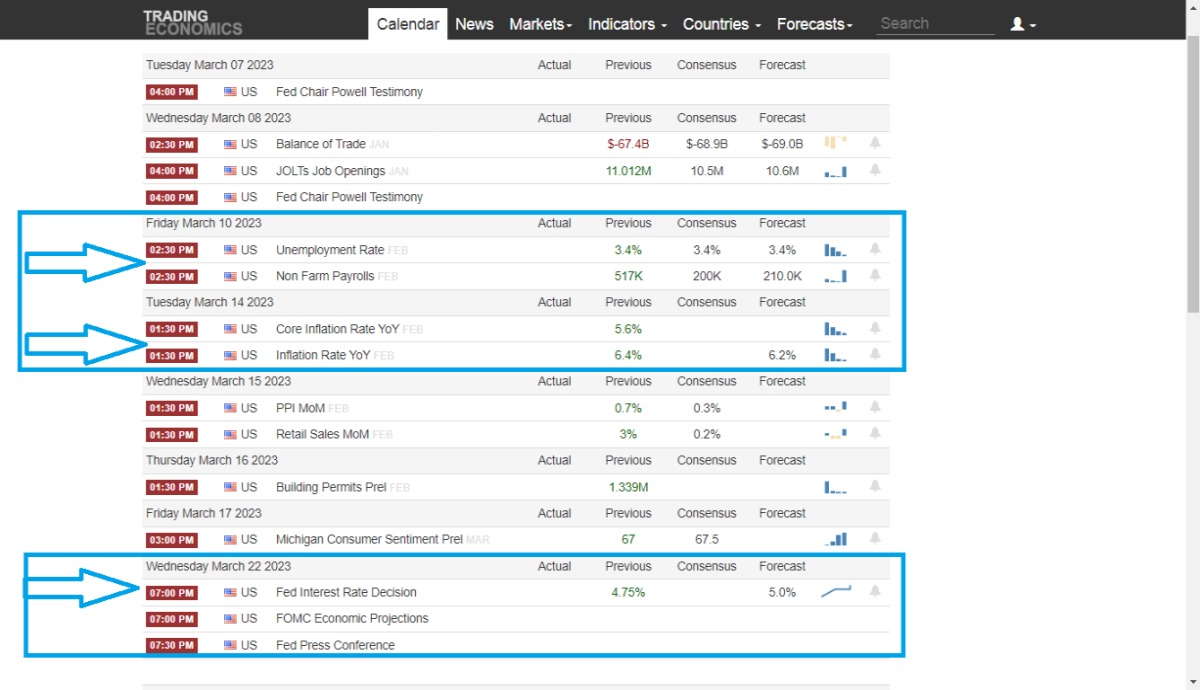
Tuesday 14th March with the announcement of inflation rates will be an important date to plan for the coming months, and above all to prepare for March 22 with the king of finance Jerome Powell.
https://tradingeconomics.com/calendar
USDC is back up to $0.97 after Circle's official statement!
Key points :
- Major exposure to BNY Mellon Bank and highly liquid US Treasuries.
- SVB wire transfer processed by Circle (prior to FDIC bank closure) could be processed on Monday.
- In the worst-case scenario, "Circle, as required by law under the Stored-Value Money Transmission Regulations, will stand behind the USDC and cover any shortfalls using company resources. , involving external capital if necessary.
https://www.circle.com/blog/an-update-on-usdc-and-silicon-valley-bank

👉 Follow the links below to the best & Secured Exchanges that I use for trading & often gives rewards for using their platform like Learn & Earn Program, making deposit & Trading on spot or Futures, Trading Competition, ...etc.
📈 Kucoin: Rewards for users Up to 10 millions USDT
https://www.kucoin.com/ucenter/signup?rcode=Kvyf2d
📈 Bybit: Get up to 4030 USDT in rewards just by signing up!
https://www.bybit.com/app/register?ref=7Wgmj
📈 Huobi: Get $150 welcome bonus by signing up!
https://www.huobi.com/en-us/v/register/double-invite/?inviter_id=11345710&invite_code=33423
📈 Okx: Get Mystery Boxes worth up to $10,000 now
https://www.okx.com/join/1867334
👀 Follow the Links Below to my Telegram Channels:
☑️ TA in English: https://t.me/tradingwithbinance
☑️ TA in French: https://t.me/Adaminssane1
☑️ Airdrop in English: https://t.me/Adaminsane