
What's goin on, Investors?
Bitcoin is back above $93,000 for the first time since December 11, but the champagne corks are still on ice. While the 6.6% weekly rally has given exhausted bulls a breather, on-chain flows, futures gaps, and whale order books all whisper the same warning: this could still be a classic liquidity grab before a deeper dive.
Below are the five data points I’m watching closest to decide whether BTC confirms a new leg up or sweeps the $80k lows that 2019-style fractal traders keep broadcasting.
Venezuela's volatility ≠ durable bid
The spark for this week’s move came from Caracas, not Chicago. A fresh round of FX controls and civil unrest sent locals into BTC and USDT pairs on P2P exchanges, pushing global spot prices higher.
Translation: The bid is real but event-driven. If headlines cool, so does the flow. Watch the VES/BTC premium on LocalBitcoins—once it collapses back to <5% versus USD markets, the geopolitical tail-risk premium is gone.
Two CME gaps still hang over the price
Bitcoin futures opened the year, leaving two air-pockets on the CME board:
- $90,500–$91,600
- $88,200–$88,800
Since 2020, 87% of CME gaps have closed within 45 calendar days. We’re only five days into the window, so odds favor a revisit before any sustainable move to six figures.
Whales are distributing, not accumulating
Glassnode’s “whale cohort” (1k–10k BTC) has shed 40k coins since December 28—the fastest 7-day decline since March 2024.
Meanwhile, Material Indicators shows the $100k ask wall that pinned price for three weeks has vanished.
That’s not bullish absorption; it’s defenders stepping aside. Until we see persistent purple dots (bid walls) re-appear above the spot, rallies remain sell-the-news events.
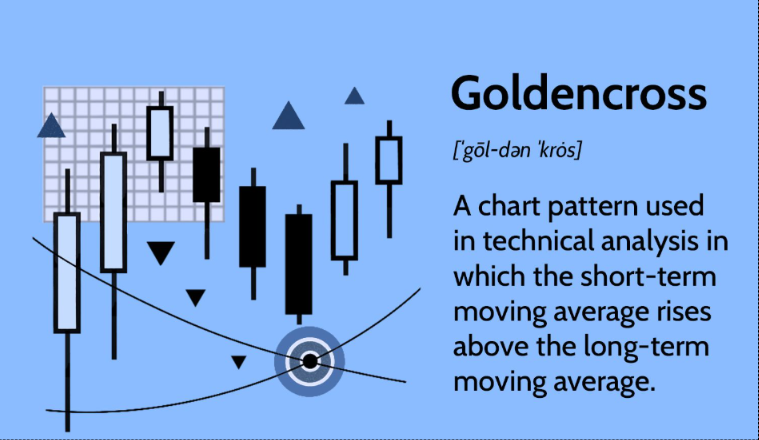
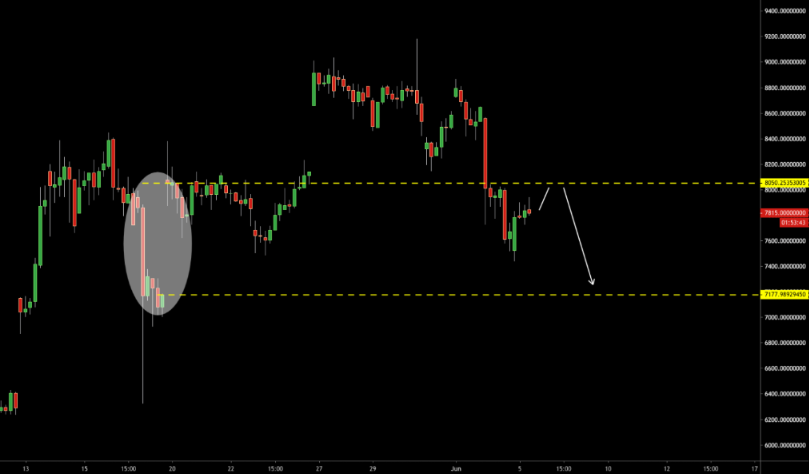
Golden cross on the 4-hour… but it’s lagging
The 50-period SMA is hours away from crossing above the 200-period on the 4-hour chart. Historically, this setup has a 62% hit-rate for an additional +8% move within two weeks (K33 Research, 2021-25 dataset).
Caveat: The last two 4-hr golden crosses (Aug-24 and Nov-24) both occurred after a sweep of local lows. In plain English, price may need to wick below $88k before the cross validates.
Macro week: payrolls can kill the “Fed cut” meme
Friday’s non-farm payrolls print is expected at 185k. A number above 250k would push March rate-cut probability below 30% (CME FedWatch). Risk assets hate sticky labor data, and BTC’s 30-day correlation to NASDAQ just rebounded to 0.68—its highest since October.
Flow chart: Hot jobs → stronger DXY → weaker BTC → gap-fill at $88k becomes the path of least resistance.
My Final Thoughts
A daily close above $93,700 with >$400m long liquidations and whale inflows >5k BTC would flip me short-term constructive. Anything less keeps the 2019 fractal in play: liquidity run to $93–94k, sweep of $80k lows, then the real pump.
Until those stars align, I’m keeping spot bids staggered at $88,200 and $83,400 and won’t chase with size. In Bitcoin, the bull trap usually looks exactly like early breakout euphoria—just like this week.
This is NEVER trading advice. DYOR manage your risk, and never bet the farm on a single candle.
Until next time, The Dark Sage singing out ✌️
Faucets That Work:
POLYGON ECOSYSTEM TOKEN FAUCET
Banks & Exchanges:
CAPITAL ONE SHOPPING GET 40.00 for YOU & 40.00 for ME