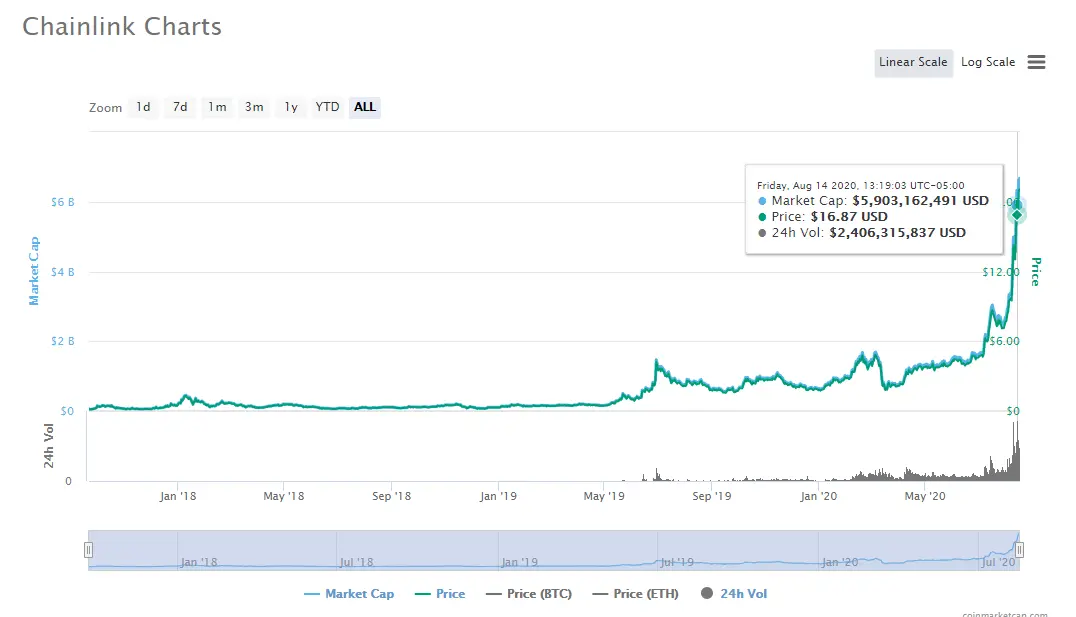
So starting from a couple of weeks ago I noticed that
Link tends to go parabolic on the weekends but most
times specifically on a Sunday. At first, I started thinking
that it was just a few random coincidences but after
my 4th week of noticing the newly discovered pattern
I decided to investigate Links chart history to see
if I could find any significant price spikes on a particular
day or days going back to Sunday, May 12, 2019.
And I discovered multiple discrepancies with the price
movements on specific days which confirmed my suspicions.
As a disclaimer, I want to say that I'm not a financial
adviser so this is not in any way, shape, or form a financial
advise. Please do not take these findings as a cause
to invest or execute trades with Chainlink. This
is merely my observation which can change at any
time since the Crypto markets, including Link, can be
very volatile and unpredictable.
First, do your research concerning any Cryptocurrency
that you wish to invest in.
With that said check out these dates on the Chainlink
chart history starting from Sunday, May 12, 2019
and tell me what do you think.
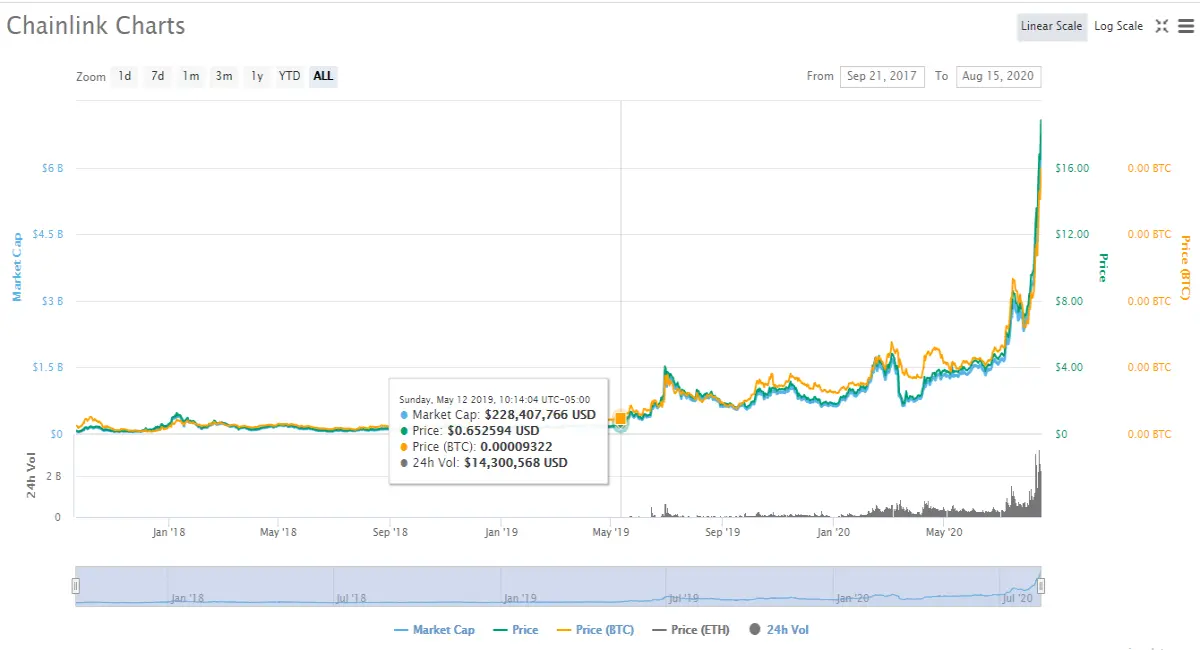
As you can also see on the chart below there was a
very sudden and powerful move to the upside beginning
on Friday the 28th of June 2019. If you check this out for
your self you will see that the price marker is right at the
very start/bottom of the spike. This price spike took place
from Saturday to Sunday to be more specific.

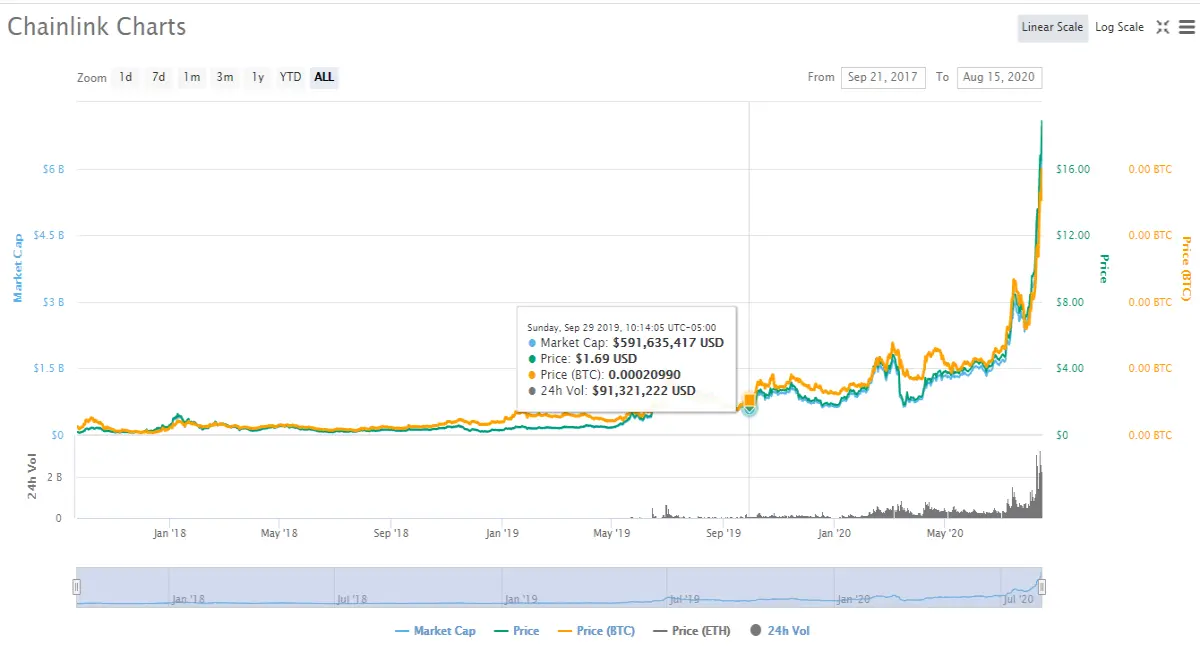
Below is an illustration of another small price spike which
which took place on Sunday, September 29, 2019.
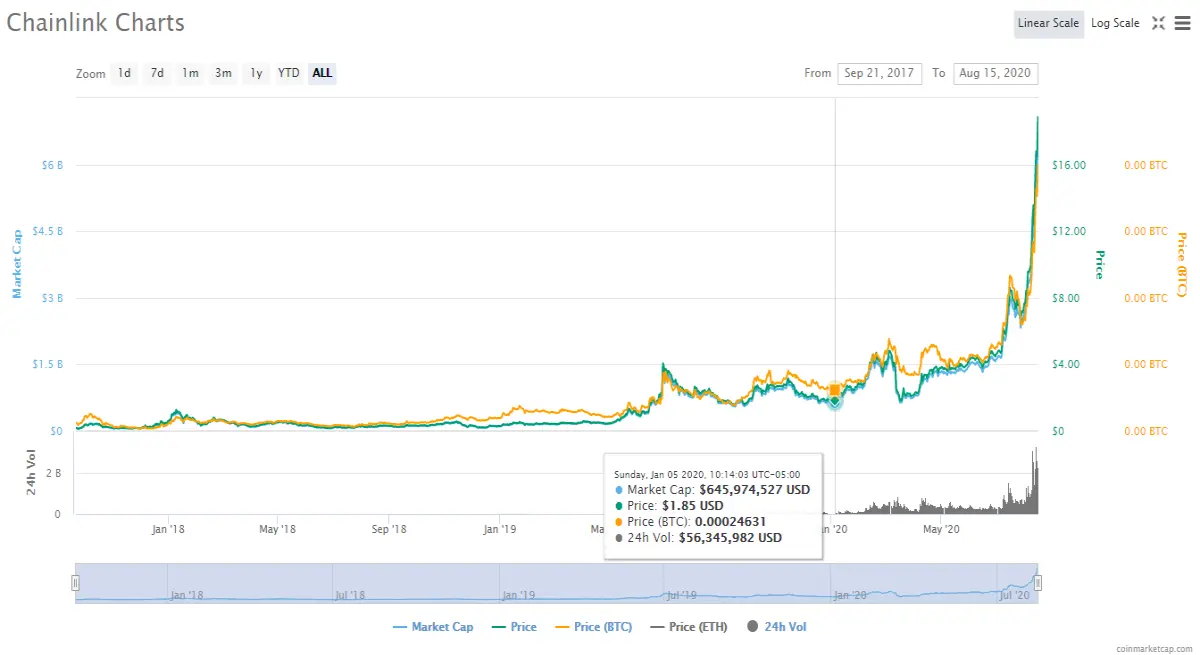
Here is yet another small price spike on Sunday, January
5, 2020. This one was small but it still counts.
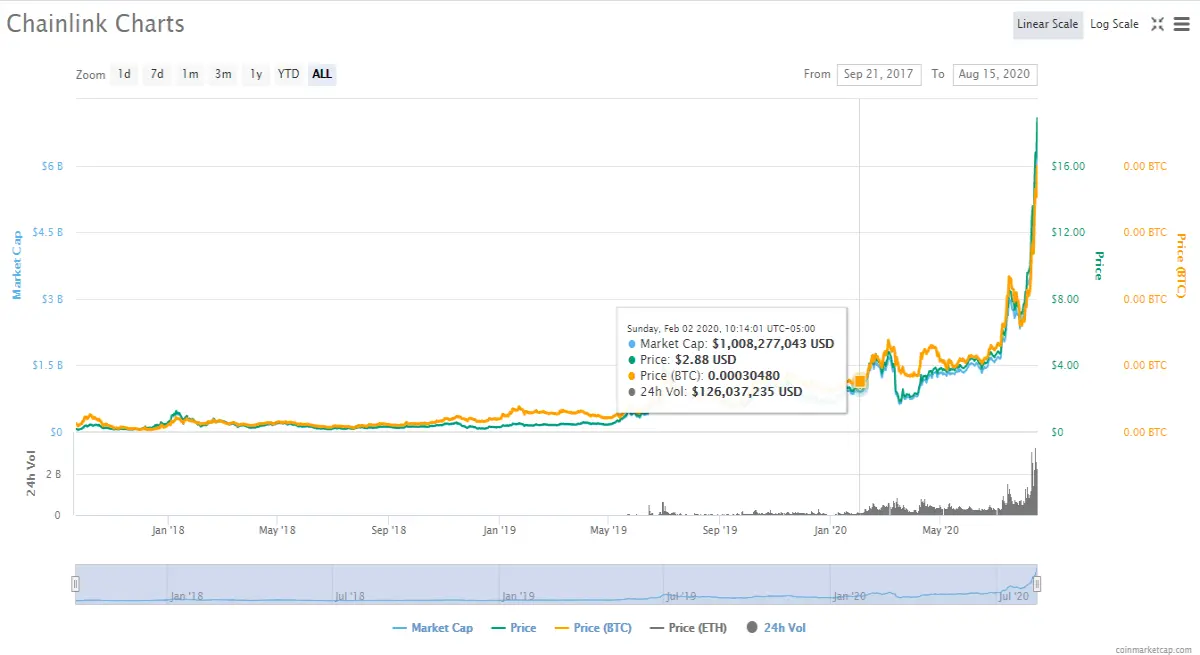
This one below that happened on February 2, 2020
seems to be at the very beginning of an upward trend.
I remember one time a bigger spike happened on a Monday.
in that one case, it was a Sunday/Monday spike.
As you can see in the chart below there was a really nice
price spike on Sunday, April 5, 2020

There is yet another one on Sunday, July 5, 2020, on
the chart below

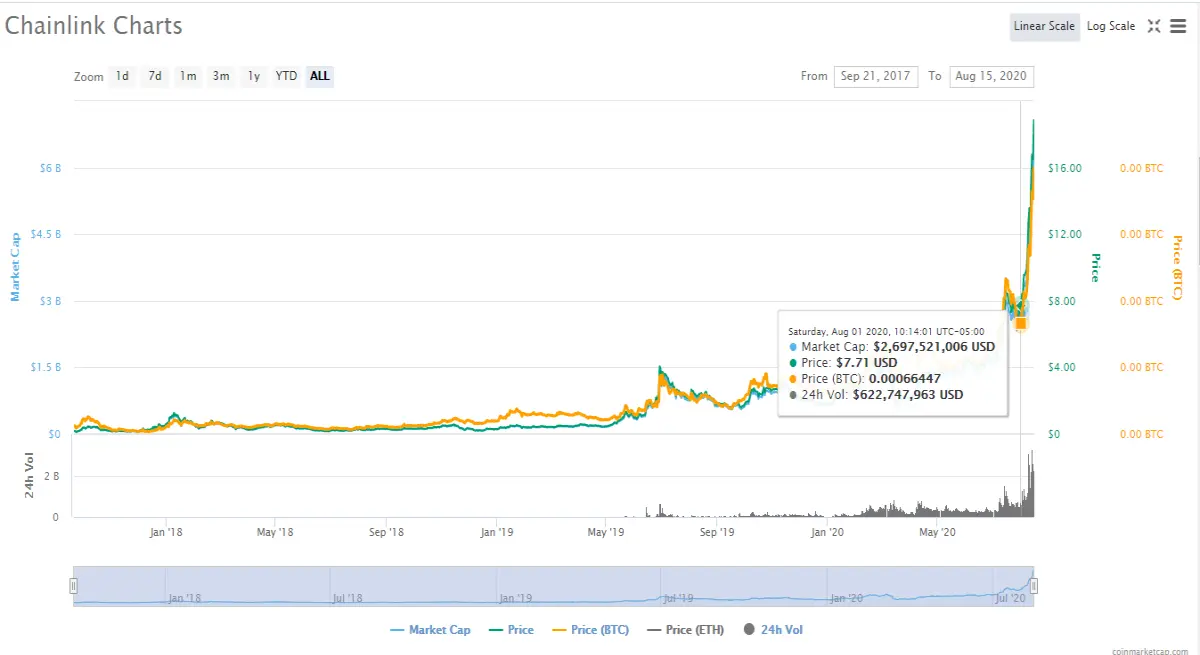
On the chart below you will see the price marker at the
start of one of the most parabolic moves which begun
on Sunday, August 1, 2020!
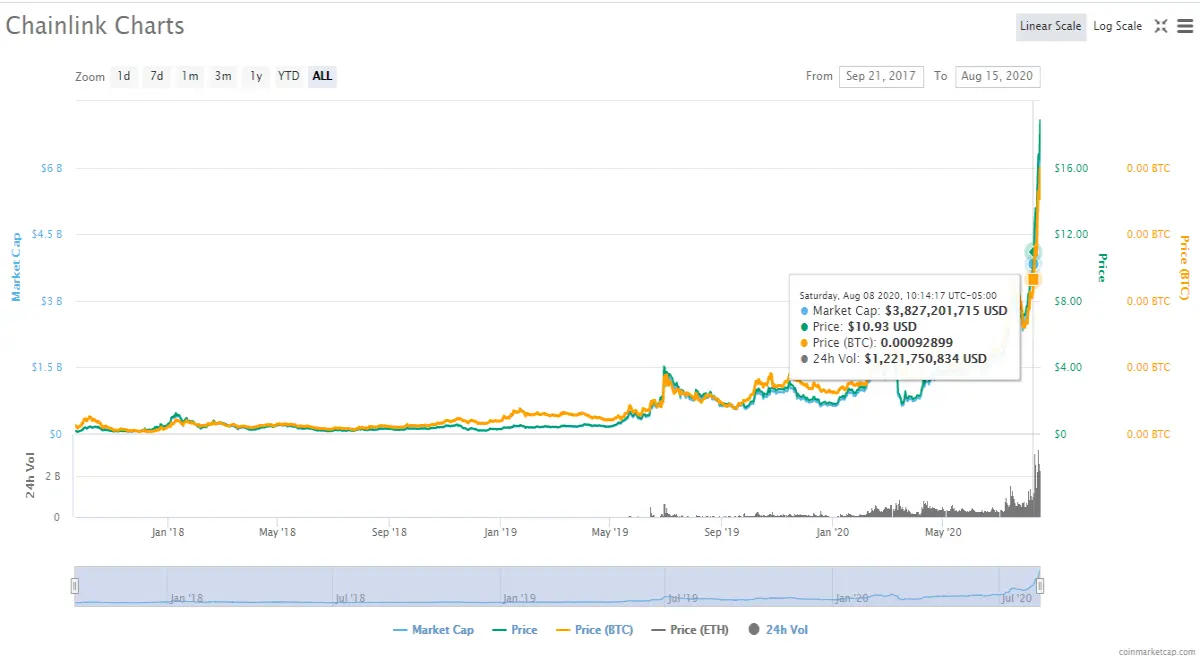
On the chart below Link begun to spike hard on Saturday
August 8 2020 and continued into Sunday.
I've come to the conclusion that Chainlink shines
brightest on the weekends. This was once again
proven this weekend when there was a sharp
price spike up from $16.87 starting Friday, August
14 to $18.94 on Saturday, August 15. Currently
(Sunday) Link keeps flirting with the $20 mark
and this is because $20 is a phycological
level of resistance. regardless of that fact
I think that it's only a matter of time before
this wanna be $20 resistance level lol get
smashed like a teenage couple on prom night.
The reason for these weekend price spikes
maybe caused by a number things one of
which may simply be that people usually get
paid on the weekends and they buy Link at
that specific time causing a surge in the volume
and price. I am well aware that Link spikes at
anytime on any given day, but this was just to
highlight specific days that I noticed it spiking
consistently over a period of time.