
The ratio basically compares how Michael Saylor’s high-stakes Bitcoin bet is outpacing Warren Buffett’s value strategy.
As the week wound down, the post-election excitement, sparked by Trump’s victory seemed to fade rapidly in the U.S stock market. The S&P 500 has surrendered a third of its gains since the election and is down for the week, while the Nasdaq 100 Index culminated with a four-day losing streak. While traditional markets falter, Bitcoin tells a different story altogether. Despite a slight pullback from its record high set earlier this week, Bitcoin remains a standout performer, boasting a nearly 30% rally since the presidential election.
While stock investors may be recalibrating their outlook on economic policies, interest rates, or broader geopolitical developments post-election, a different dynamic is playing out in the world of digital assets. The anticipation of a game-changing regulatory agenda by the President-elect while creating a strategic US stockpile of Bitcoin is enough to keep the interest of market participants in cryptocurrencies going.
To highlight this idea of divergence playing out in stocks, we analyze the Saylor-Buffett ratio - developed by Owen Lamont, a portfolio manager at Acadian Asset Management, this ratio captures how MicroStrategy's stock, influenced heavily by its exposure to Bitcoin and aggressive tech investments, has oscillated relative to Berkshire Hathaway's, a conservative investment firm known for its value-investing approach under the legendary investor, Warren Buffett.
The chart below by Bloomberg quantifies the relationship. Specifically, it tracks the MicroStrategy-to-Berkshire Hathaway share price ratio, effectively charting how MicroStrategy’s stock price has performed in comparison to Berkshire Hathaway's. The timeline on the x-axis spans from 2020 to late 2024, while the y-axis represents the MicroStrategy-Berkshire Hathaway share price ratio. By highlighting significant fluctuations in this ratio, the chart raises questions about market exuberance, speculative investing, and contrasting investment philosophies.
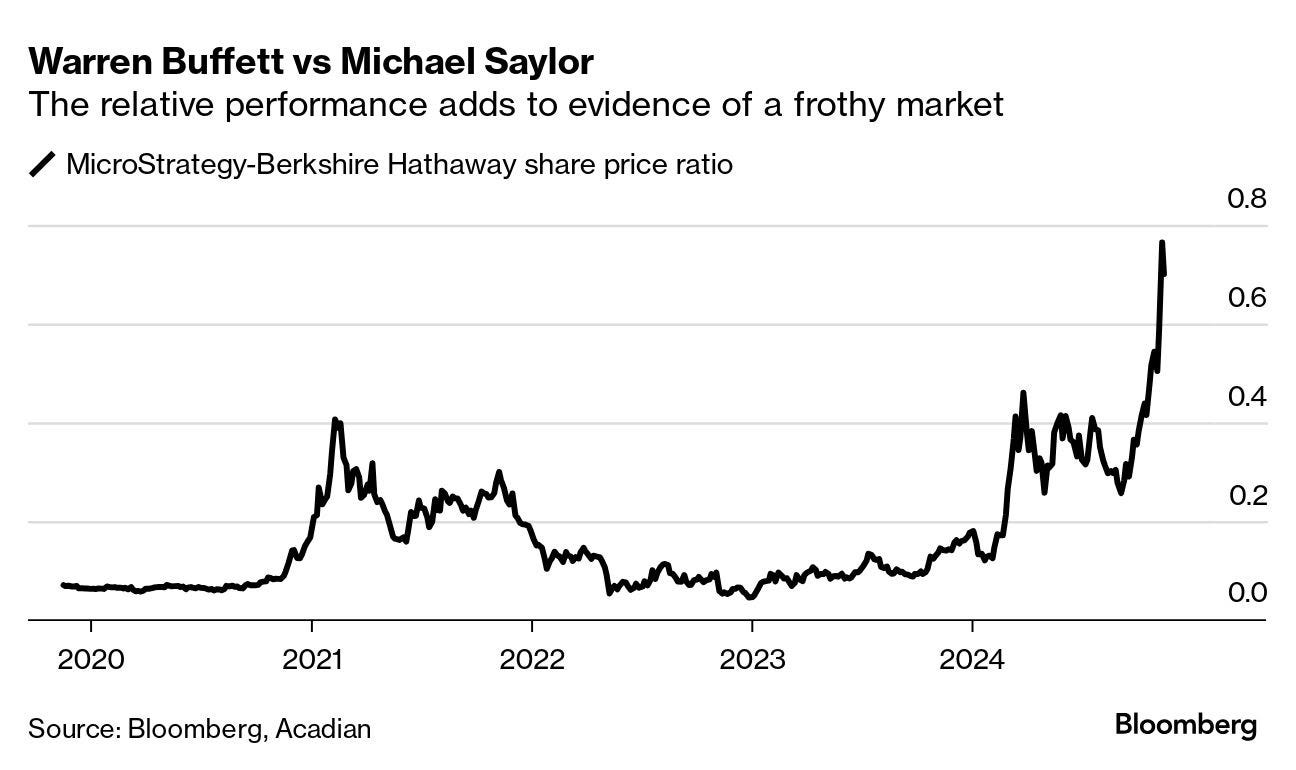
This chart symbolizes the stark contrast between Michael Saylor’s high-risk, high-reward Bitcoin-focused strategy with MicroStrategy and Warren Buffett’s conservative, value-driven approach with Berkshire Hathaway. Saylor’s alignment with Bitcoin has turned MicroStrategy into a volatile "pseudo-Bitcoin ETF," attracting speculative investors betting on crypto’s future, while Buffett’s focus on stable, well-established businesses ensures steady, predictable returns. The chart’s fluctuations highlight MicroStrategy’s extreme volatility during moments of market enthusiasm, in contrast to the consistent, grounded performance of Berkshire Hathaway.
It highlights clear trends - relative stability before 2021, indicating comparable valuations between MicroStrategy and Berkshire Hathaway - a sharp rise in early 2021 fueled by Bitcoin’s surge and MicroStrategy’s significant crypto investments, making the company a proxy for Bitcoin exposure; a correction in mid-2021 as Bitcoin prices stabilized, revealing MicroStrategy’s vulnerability to crypto volatility; and a resurgence in 2023-2024, driven by renewed speculation, growing cryptocurrency interest, and broader tech rallies, reflecting a frothy market favoring high-risk investments.
In the end, this price ratio is more than a comparison of the two companies. It’s a story of differing philosophies, market sentiment, and the potential dangers of a frothy market. Michael Saylor’s high-stakes strategy aligns with investors who believe in the transformative potential of Bitcoin, while Warren Buffett’s value-oriented approach continues to attract those seeking stability. The sharp fluctuations in the ratio hint at speculative excess, which, as history has shown, can lead to volatile market corrections. For investors, this chart serves as a reminder of the importance of aligning investment choices with personal risk tolerance and long-term financial goals.
Originally published at Substack.






