
While USD-denominated exchange flows for both BTC and ETH have shrunk, Bitcoin has lost a bigger share of dominance
The good news for the digital assets markets in the new year has seen a nice constructive upward move so far. On the downside though, the volatility remains significantly subdued — translating into tight-range price action amid reduced activity. Considering the price action we have seen so far in the crypto market, it wouldn’t be wrong to say that it is pretty much asleep. Having said that, such price action has been a prelude to explosive moves previously — on both sides.
According to Glassnode research, coinciding with this extremely low market volatility is the softness in on-chain activity for Bitcoin (BTC) and Ethereum (ETH). And the massive drawdowns seen last year indicate 2022 is comfortably one of the deepest bear markets to date with respect to capital losses. A return on risk appetite in equities pushed BTC to $17.4k and ETH to $1340, at the time of publishing.
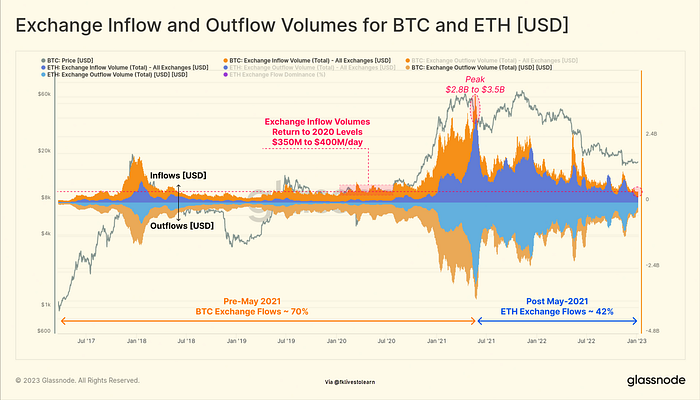
Recent on-chain activity has also been reflected in the compression of USD exchange flows for both BTC and ETH. The chart above displays inflows (positive) and outflows (negative) for BTC and ETH related to exchange entities being monitored. Currently, Bitcoin inflow volumes are between $350M and $400M per day, which is significantly lower than the multi-billion dollar levels observed in 2021–2022.
It’s also worth noting the increase in ETH exchange flows, which have grown from 30% dominance in May 2021 to 42% currently. Please note that the ETH dominance here is calculated based on the total USD exchange flows (in and out) and represented as ETH/(BTC + ETH). Current exchange flows have returned to 2020 levels — right before the explosive move that precipitated in 2021.
Originally Published on Medium
Email | Twitter | LinkedIn | StockTwits | Telegram | Newsletter






